Gå til hovedinnhold

21 innlegg merket med "pulse"

Vis alle tagger

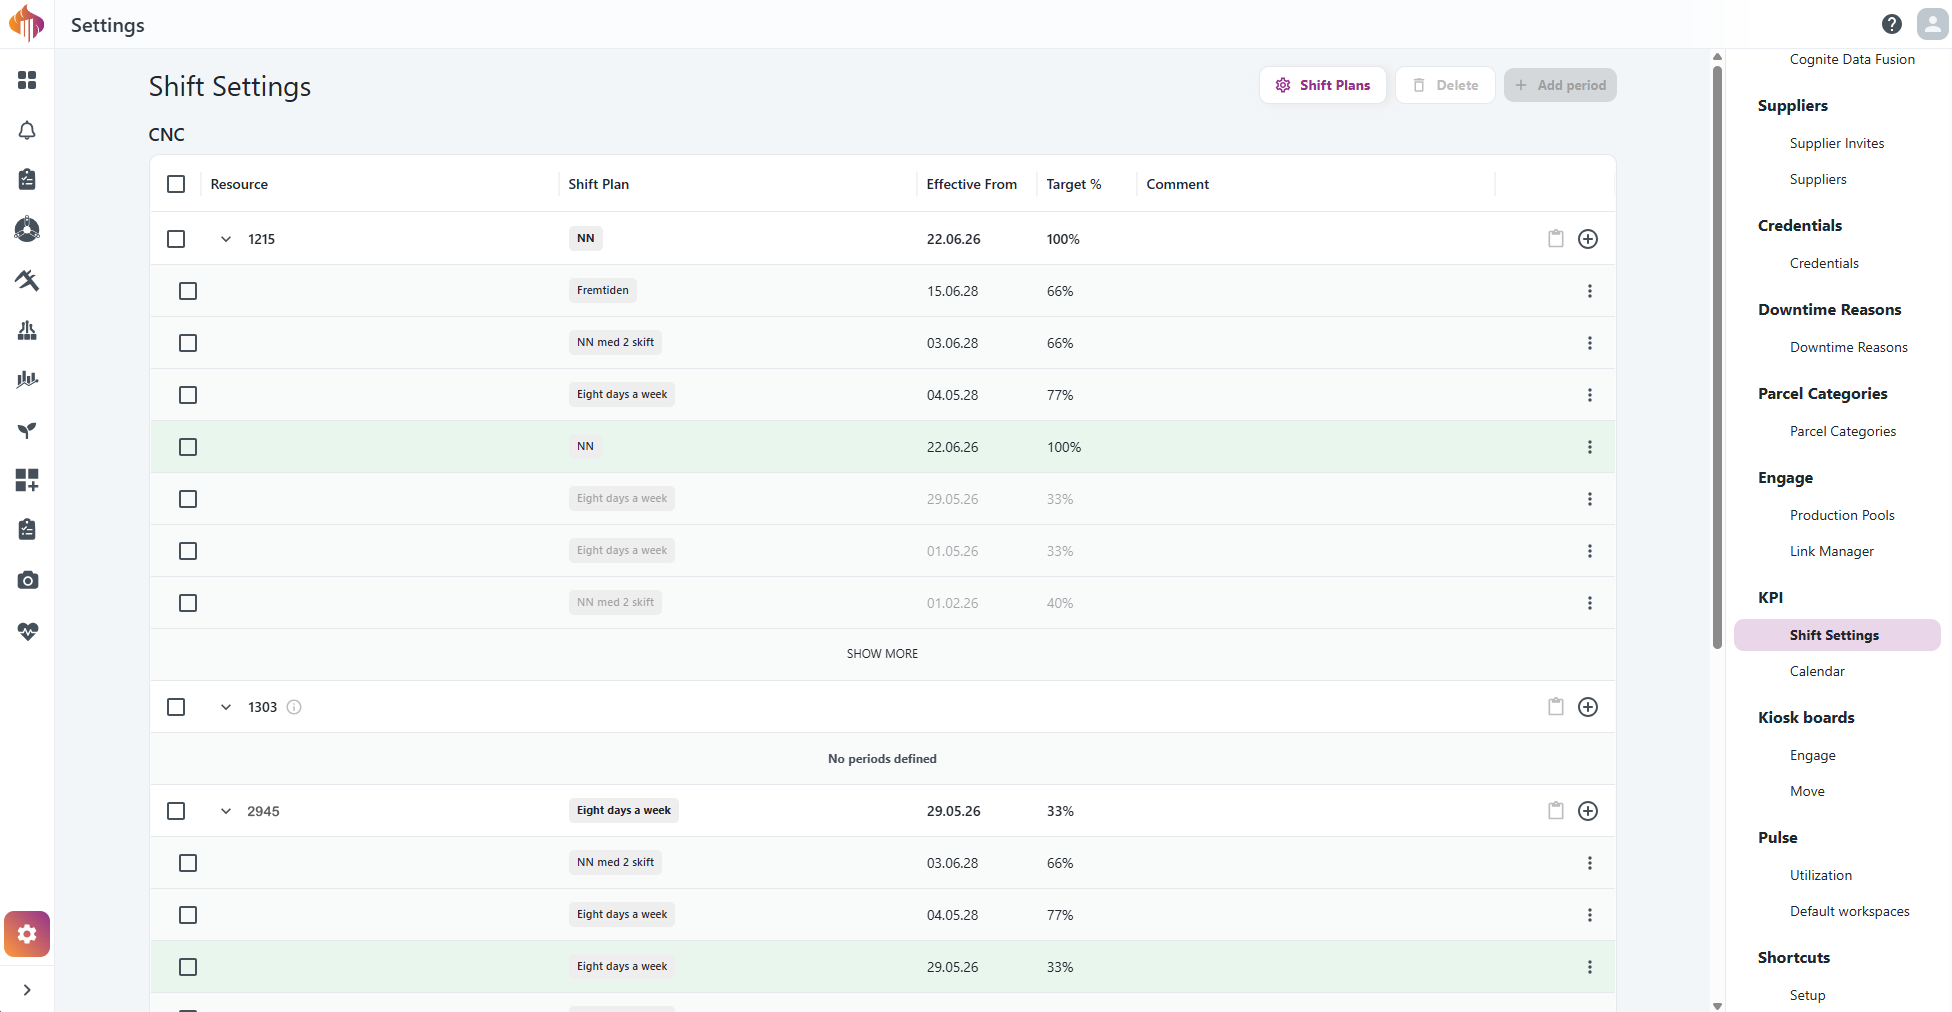
Shift Settings erstatter Capacity

· 2 min lesetid

Admin-innstillingene for Capacity er erstattet av Shift Settings. Det gir deg en bedre måte å bestemme hvordan ressursene dine jobber, og hvilken utnyttelse du forventer av dem.

Eksisterende kapasitetsdata er flyttet over automatisk. Ingenting er borte, og beregningene av KPI og OEE fungerer som før.

shift-settings

Ny Workspace-fane i Engage

· 2 min lesetid

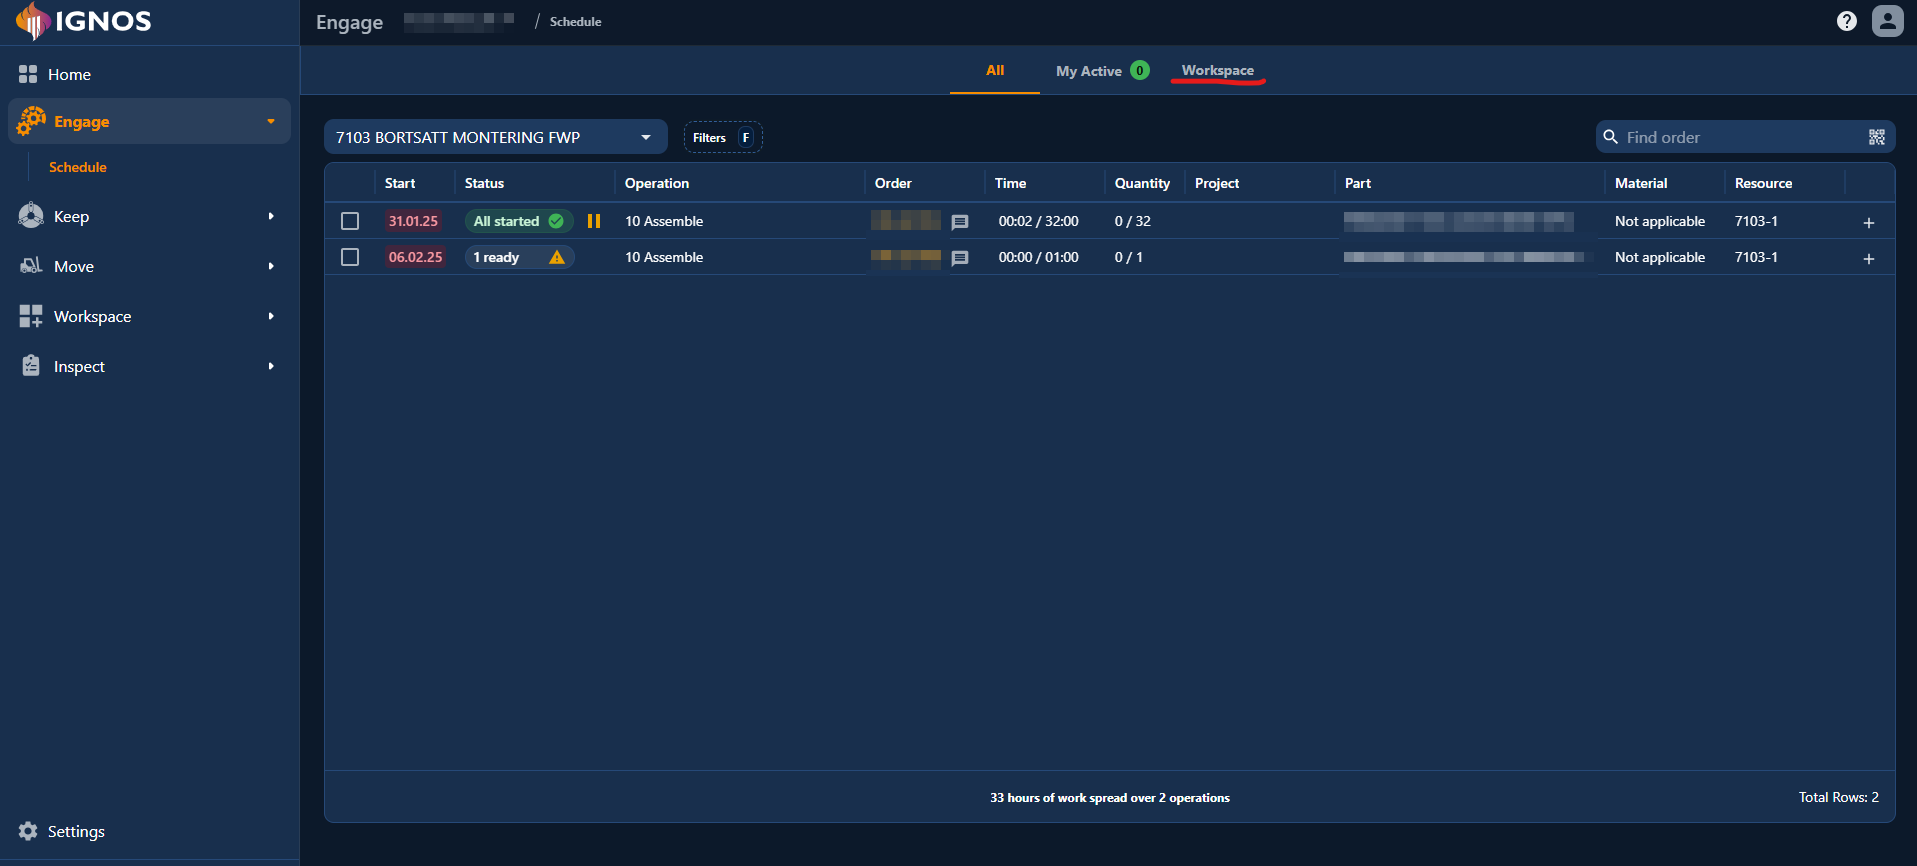
Nå kan du åpne Workspace rett fra Engage Operations. Den nye fanen Workspace ligger ved siden av All og My Active. Dermed er det enklere å veksle mellom aktive operasjoner og visninger for en bestemt ressurs uten å forlate Engage.

Workspace-fanen i Engage

Pulse: Ny oppsummering i Current States og Machine Timelines

· Ett min lesetid

Vi har oppdatert oppsummeringen på sidene Current States og Machine Timelines i Pulse. Den gir nå mer innsikt og er mer relevant for den daglige driften.

Viktigste forbedringer​

  • Top Downtime Reasons

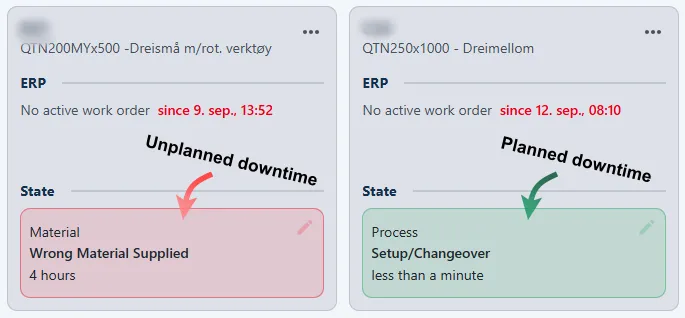
    • Grafen bruker nye farger som skiller tydelig mellom planlagte og ikke-planlagte nedetidsårsaker.
    • I stedet for å vise alle nedetidsårsaker som noen gang er rapportert, viser grafen nå de siste 90 dagene. Da får du et mer oppdatert bilde av hvordan fabrikken presterer.
  • Oppsummeringen for fabrikken følger filtrene

    • Verdiene for ressurser med aktive arbeidsordrer, nåværende maskinstatus og top downtime reasons oppdateres nå ut fra filtrene du har valgt på siden.
    • Før var disse verdiene faste og fulgte ikke filtrene du valgte.

Med disse endringene er det enklere å fokusere på de mest relevante dataene og raskt se trender eller problemer i produksjonen.


Demo:

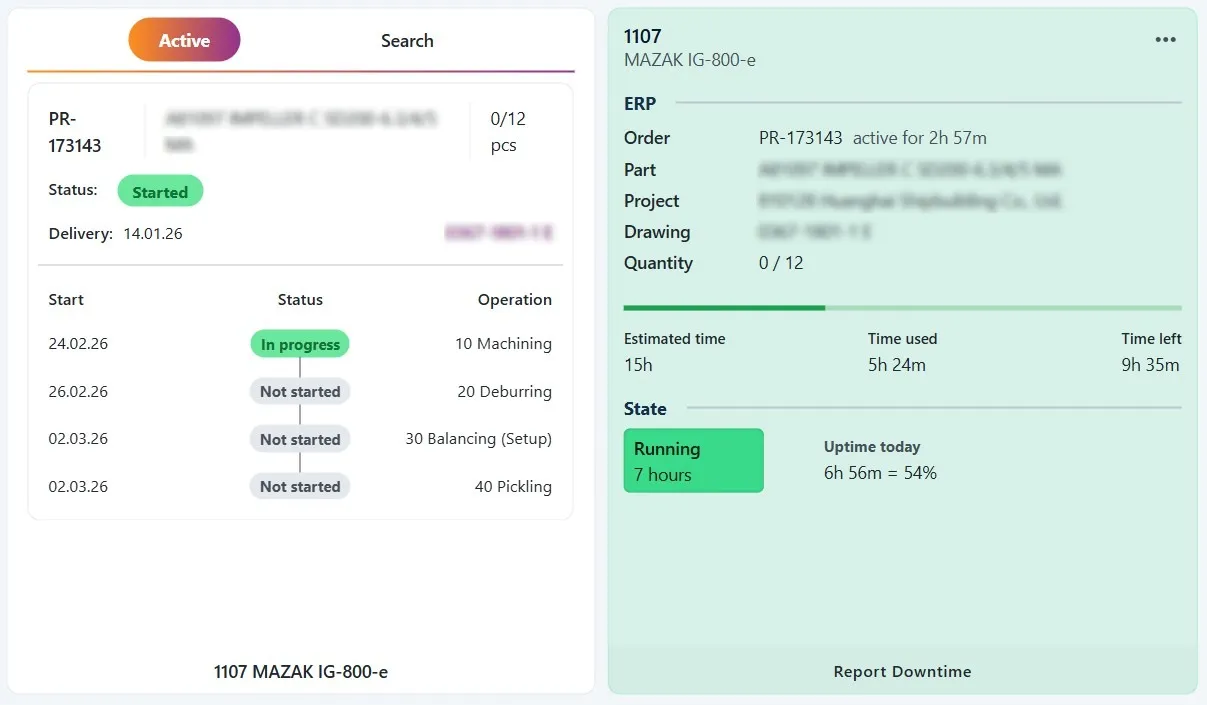
informasjon om arbeidsordre

Easier Downtime Reporting in Machine States

· Ett min lesetid

We have made it even easier to report and notice active Downtime Reasons in Machine States!

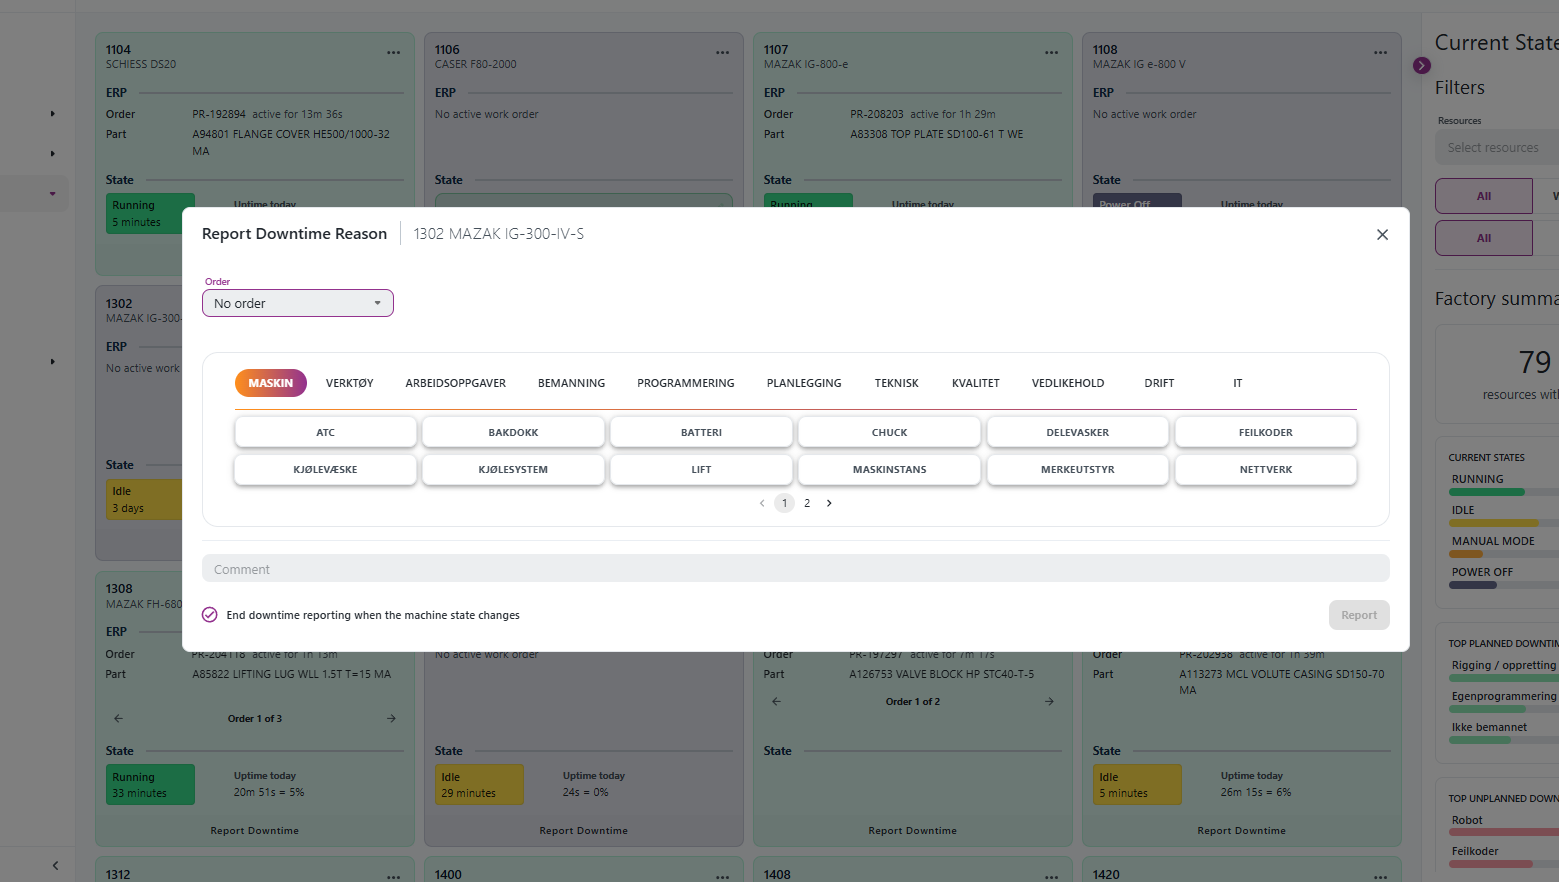
The resource card on the Machine States overview now has a dedicated Report Downtime button at the bottom. This makes it possible to report downtime for all resources. By clicking this button, you can start reporting downtime reasons just like in our report downtime widget in Workspace.

work order toggle desktop

Here is a demo: work order toggle mobile

Resources that have active downtime reports will display a marker.

work order toggle desktop

You can easily end or edit active downtime reporting by clicking the downtime report marker and pressing the stop button or checking/unchecking the "End downtime reporting when the machine state changes" option.

work order information

New Utilization Methods

· 2 min lesetid

We’ve expanded Pulse with two new utilization methods:

  • Machine Capacity utilization (OEE)
  • Calendar Capacity utilization (OOE)

Examples​

Machine Capacity utilization (OEE)​

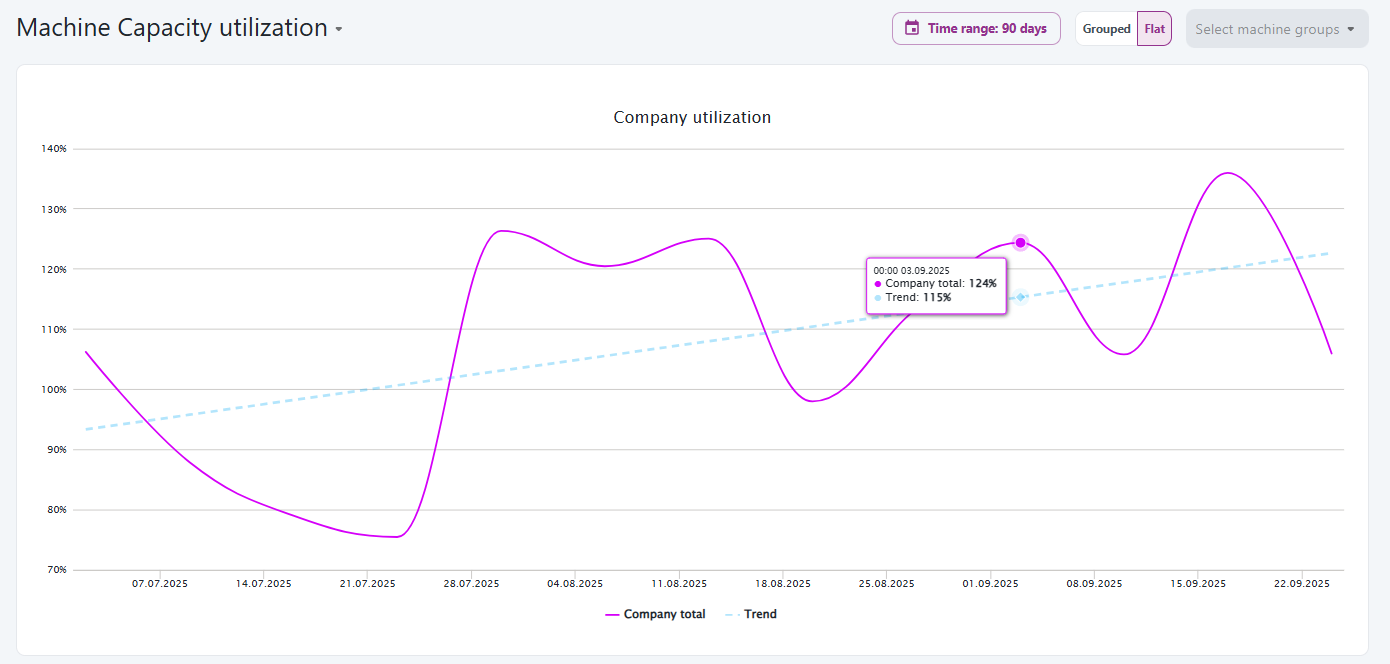
Machine Capacity utilization calculates how effectively a machine is used compared to its planned daily capacity.
Admins can dynamically configure the daily capacity for each machine.

For example:
If a machine has its Monday capacity set to 8 hours, and its uptime is 4 hours, the utilization will be 50%.
machine-capacity-graph

In systems where Performance and Quality values are available, the OEE calculation will include them. When these values are not provided, they are automatically set to 100%, meaning OEE effectively reflects Availability.

machine-capacity-table

💡 Admin Tip:
Be careful when assigning very low capacity values (for example, 0.1 h) to weekends or non-production days. If the machine runs even briefly on those days, utilization can spike to unrealistic levels (thousands of %). Set capacity to 0 h for days with no planned production to avoid distorted results.


Calendar Capacity utilization (OOE)​

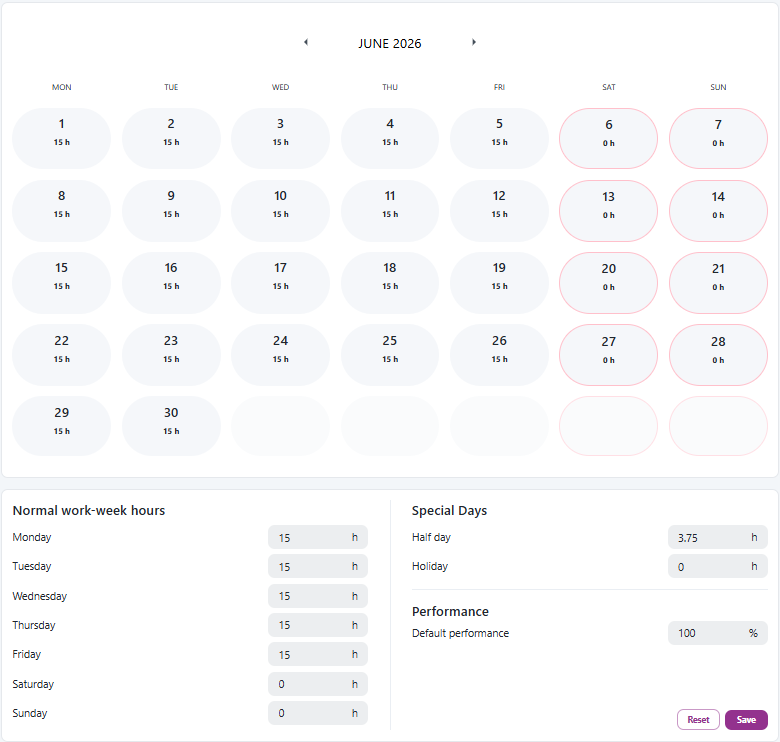
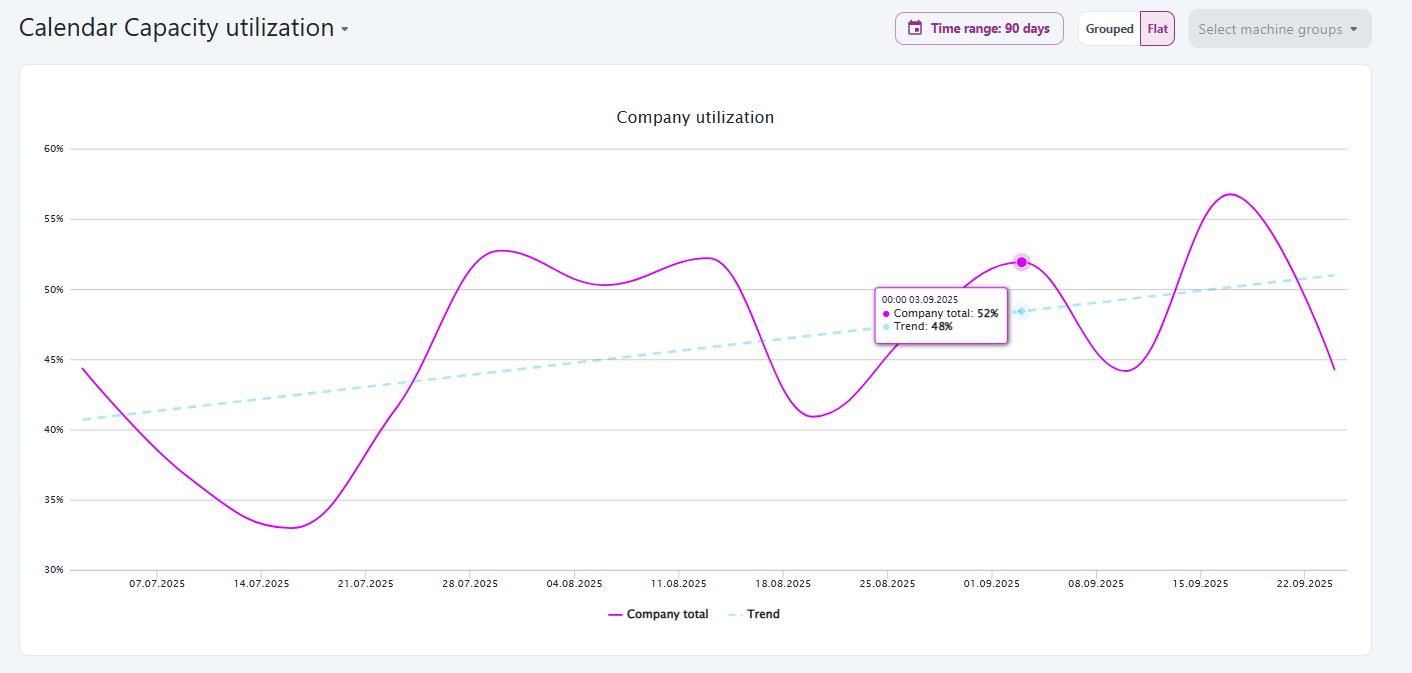
Calendar Capacity utilization calculates how effectively a machine is used compared to the company’s planned calendar capacity.
Admins can dynamically configure the calendar capacity.
calendar-capacity-graph

Just like with OEE, in systems where Performance and Quality values are available, the OOE calculation will include them. When these values are not provided, they are automatically set to 100%, meaning OEE effectively reflects Availability.

calendar-capacity-table


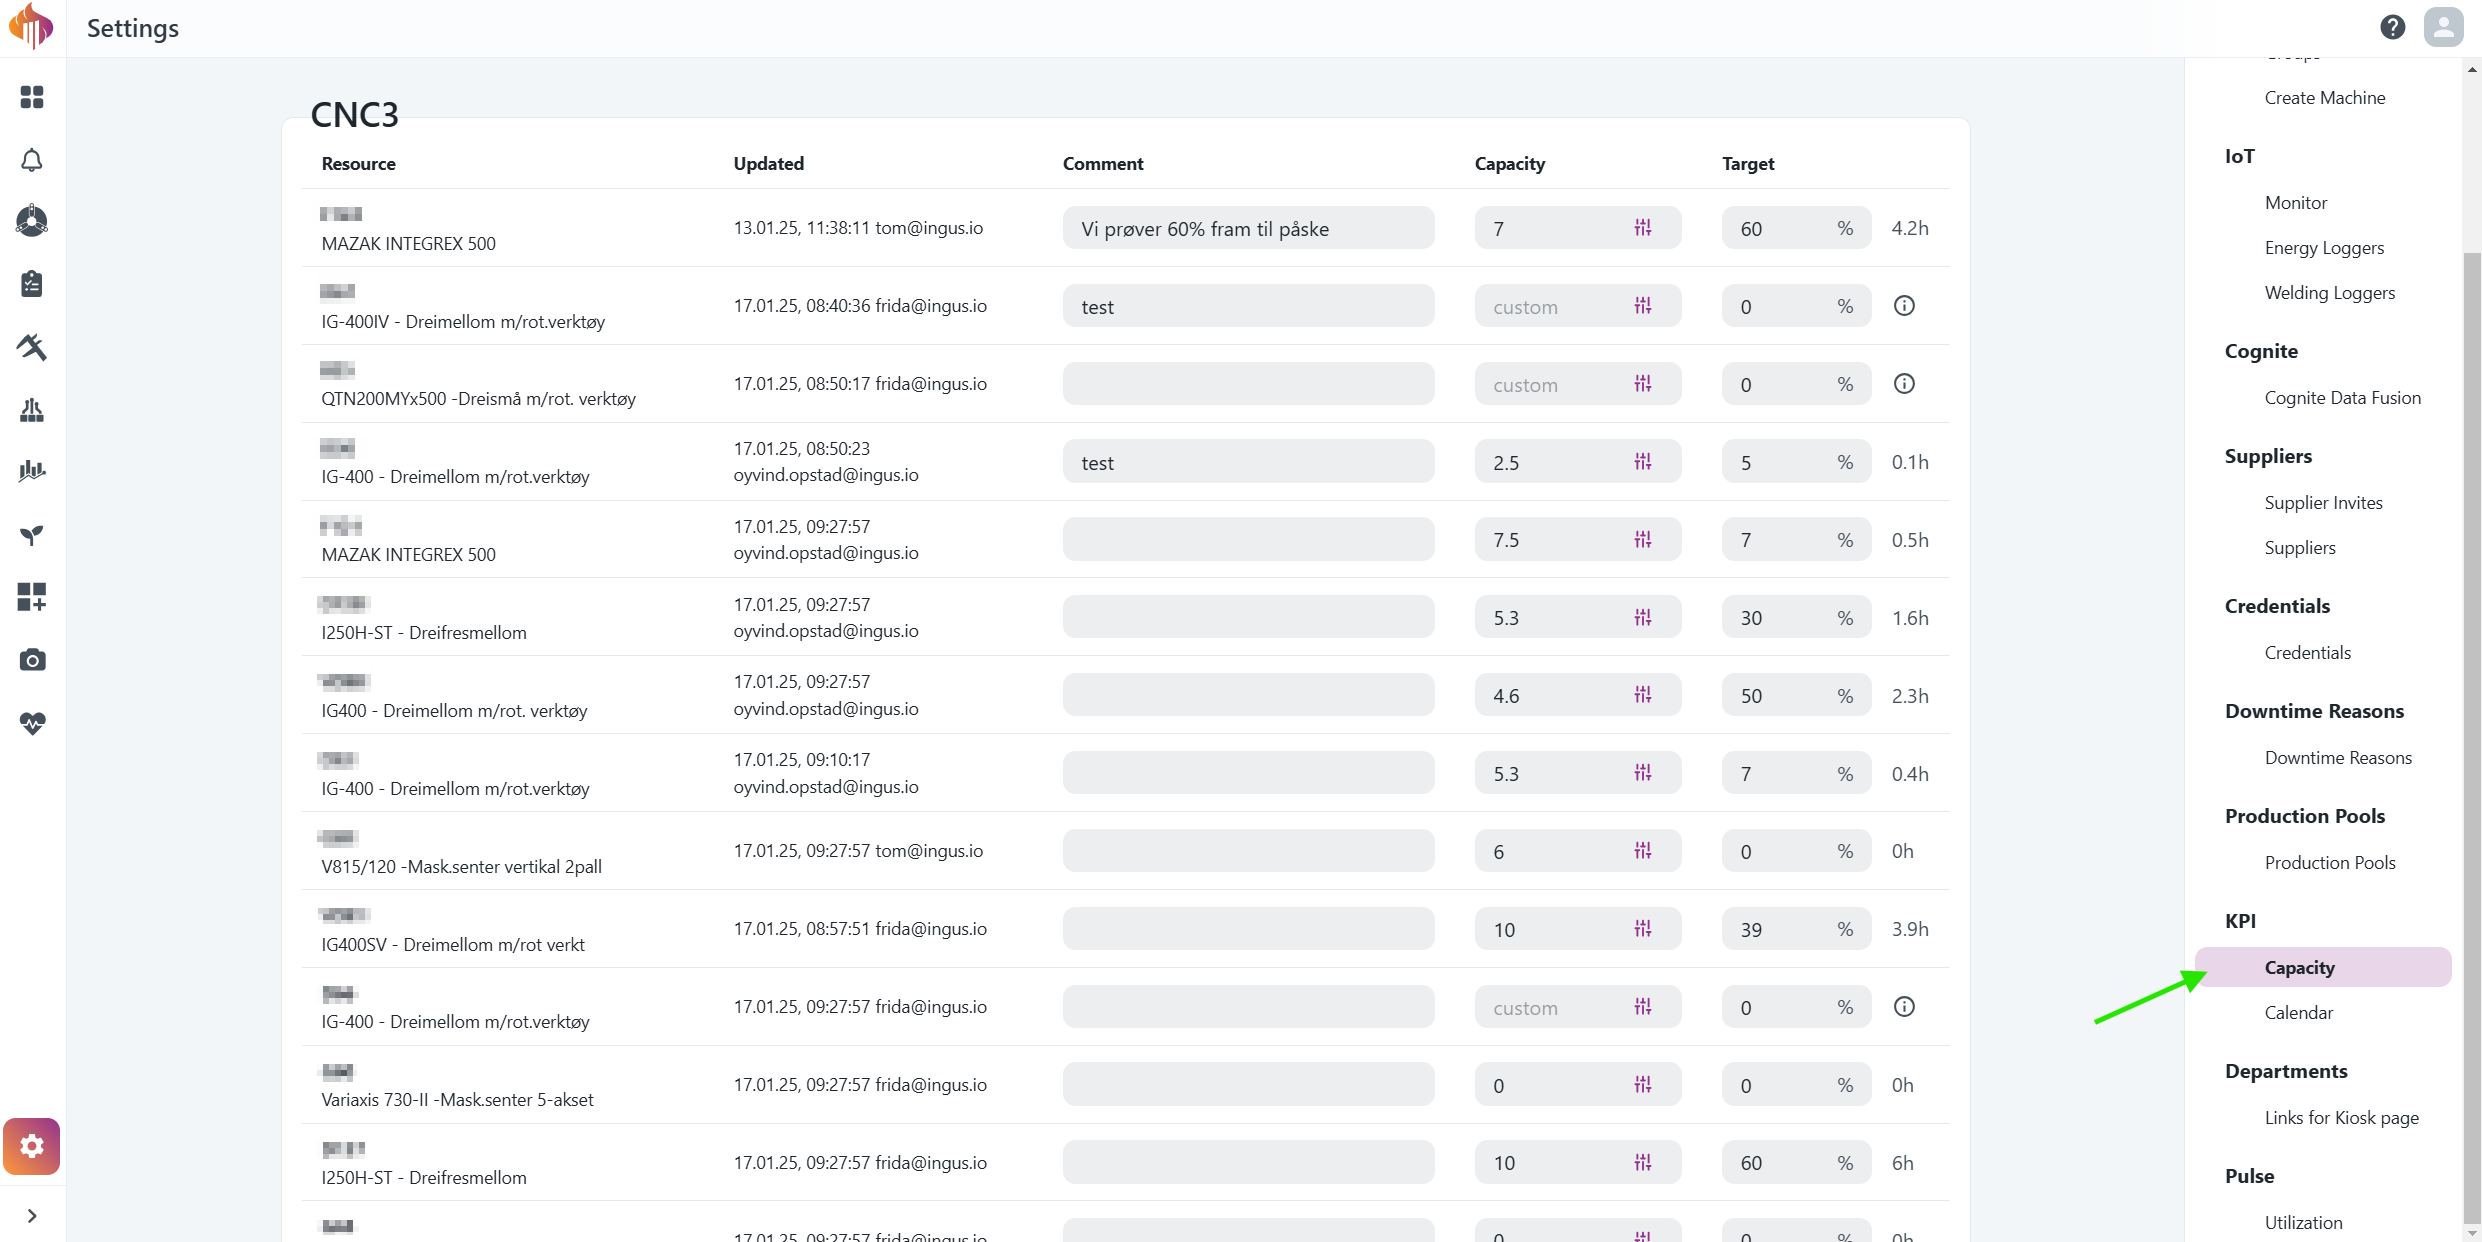
Machine Capacity settings for Admins​

capacity-admin

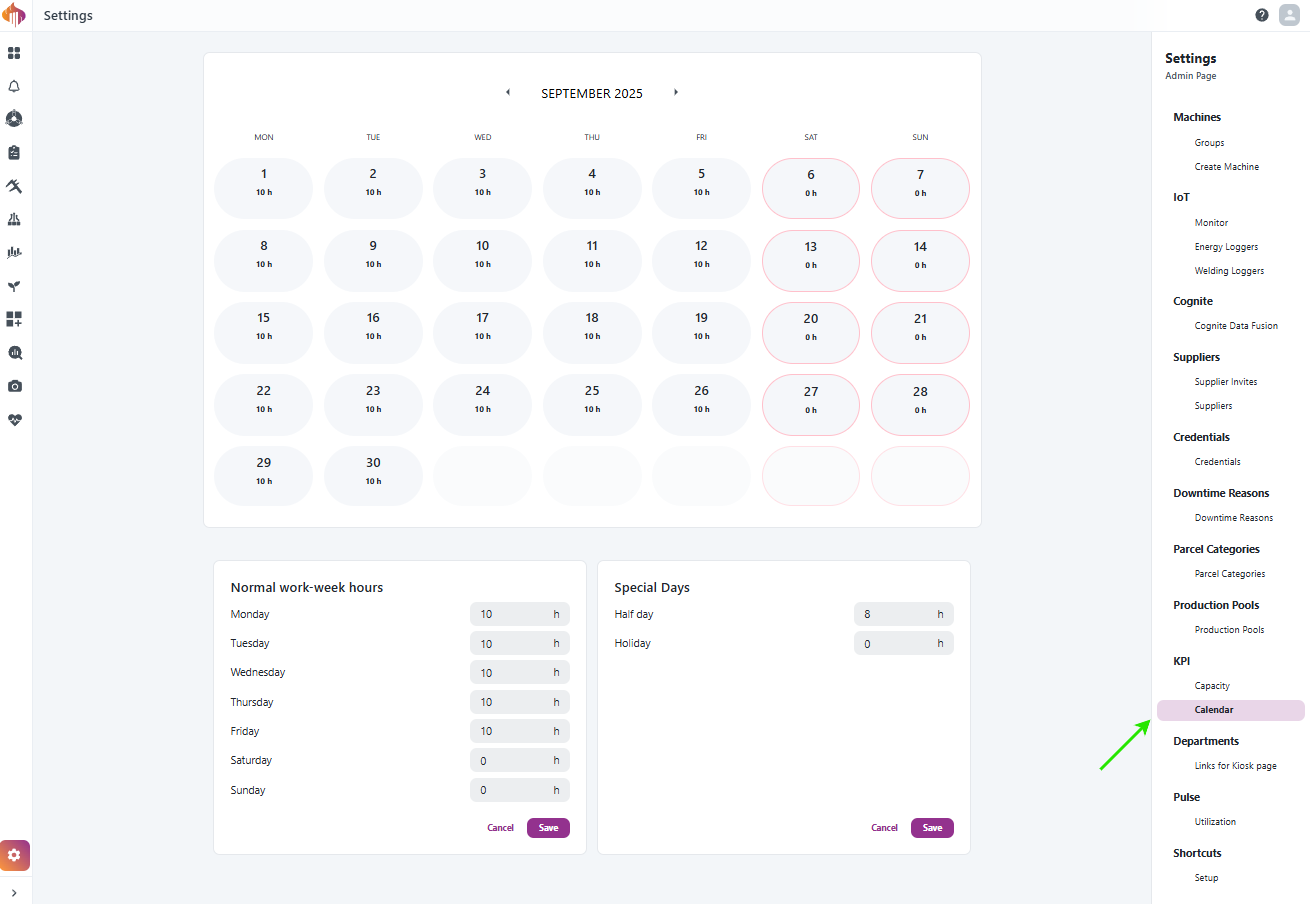
Factory Calendar settings for Admins​

factory-calendar

Fixed Y-Axis for Utilization Graphs

· Ett min lesetid

We’ve improved the readability of utilization graphs by introducing a soft maximum of 100% on the Y-axis.

What’s new​

  • When utilization values are below 100%, the Y-axis is locked at 100% for easier comparison across different insights.
  • When utilization values exceed 100%, the Y-axis dynamically adjusts beyond 100% to fit the data.
  • This ensures more consistent scaling when comparing Power-on, 24/7, Factory Calendar, and Machine Calendar utilization insights.

Example​

fixed-y-axis-utilization-graph

The Y-axis stays consistently locked at 100% until utilization values go beyond 100%, at which point the axis automatically adjusts.