Gå til hovedinnhold

Velg flere operasjoner i My Active

· Ett min lesetid

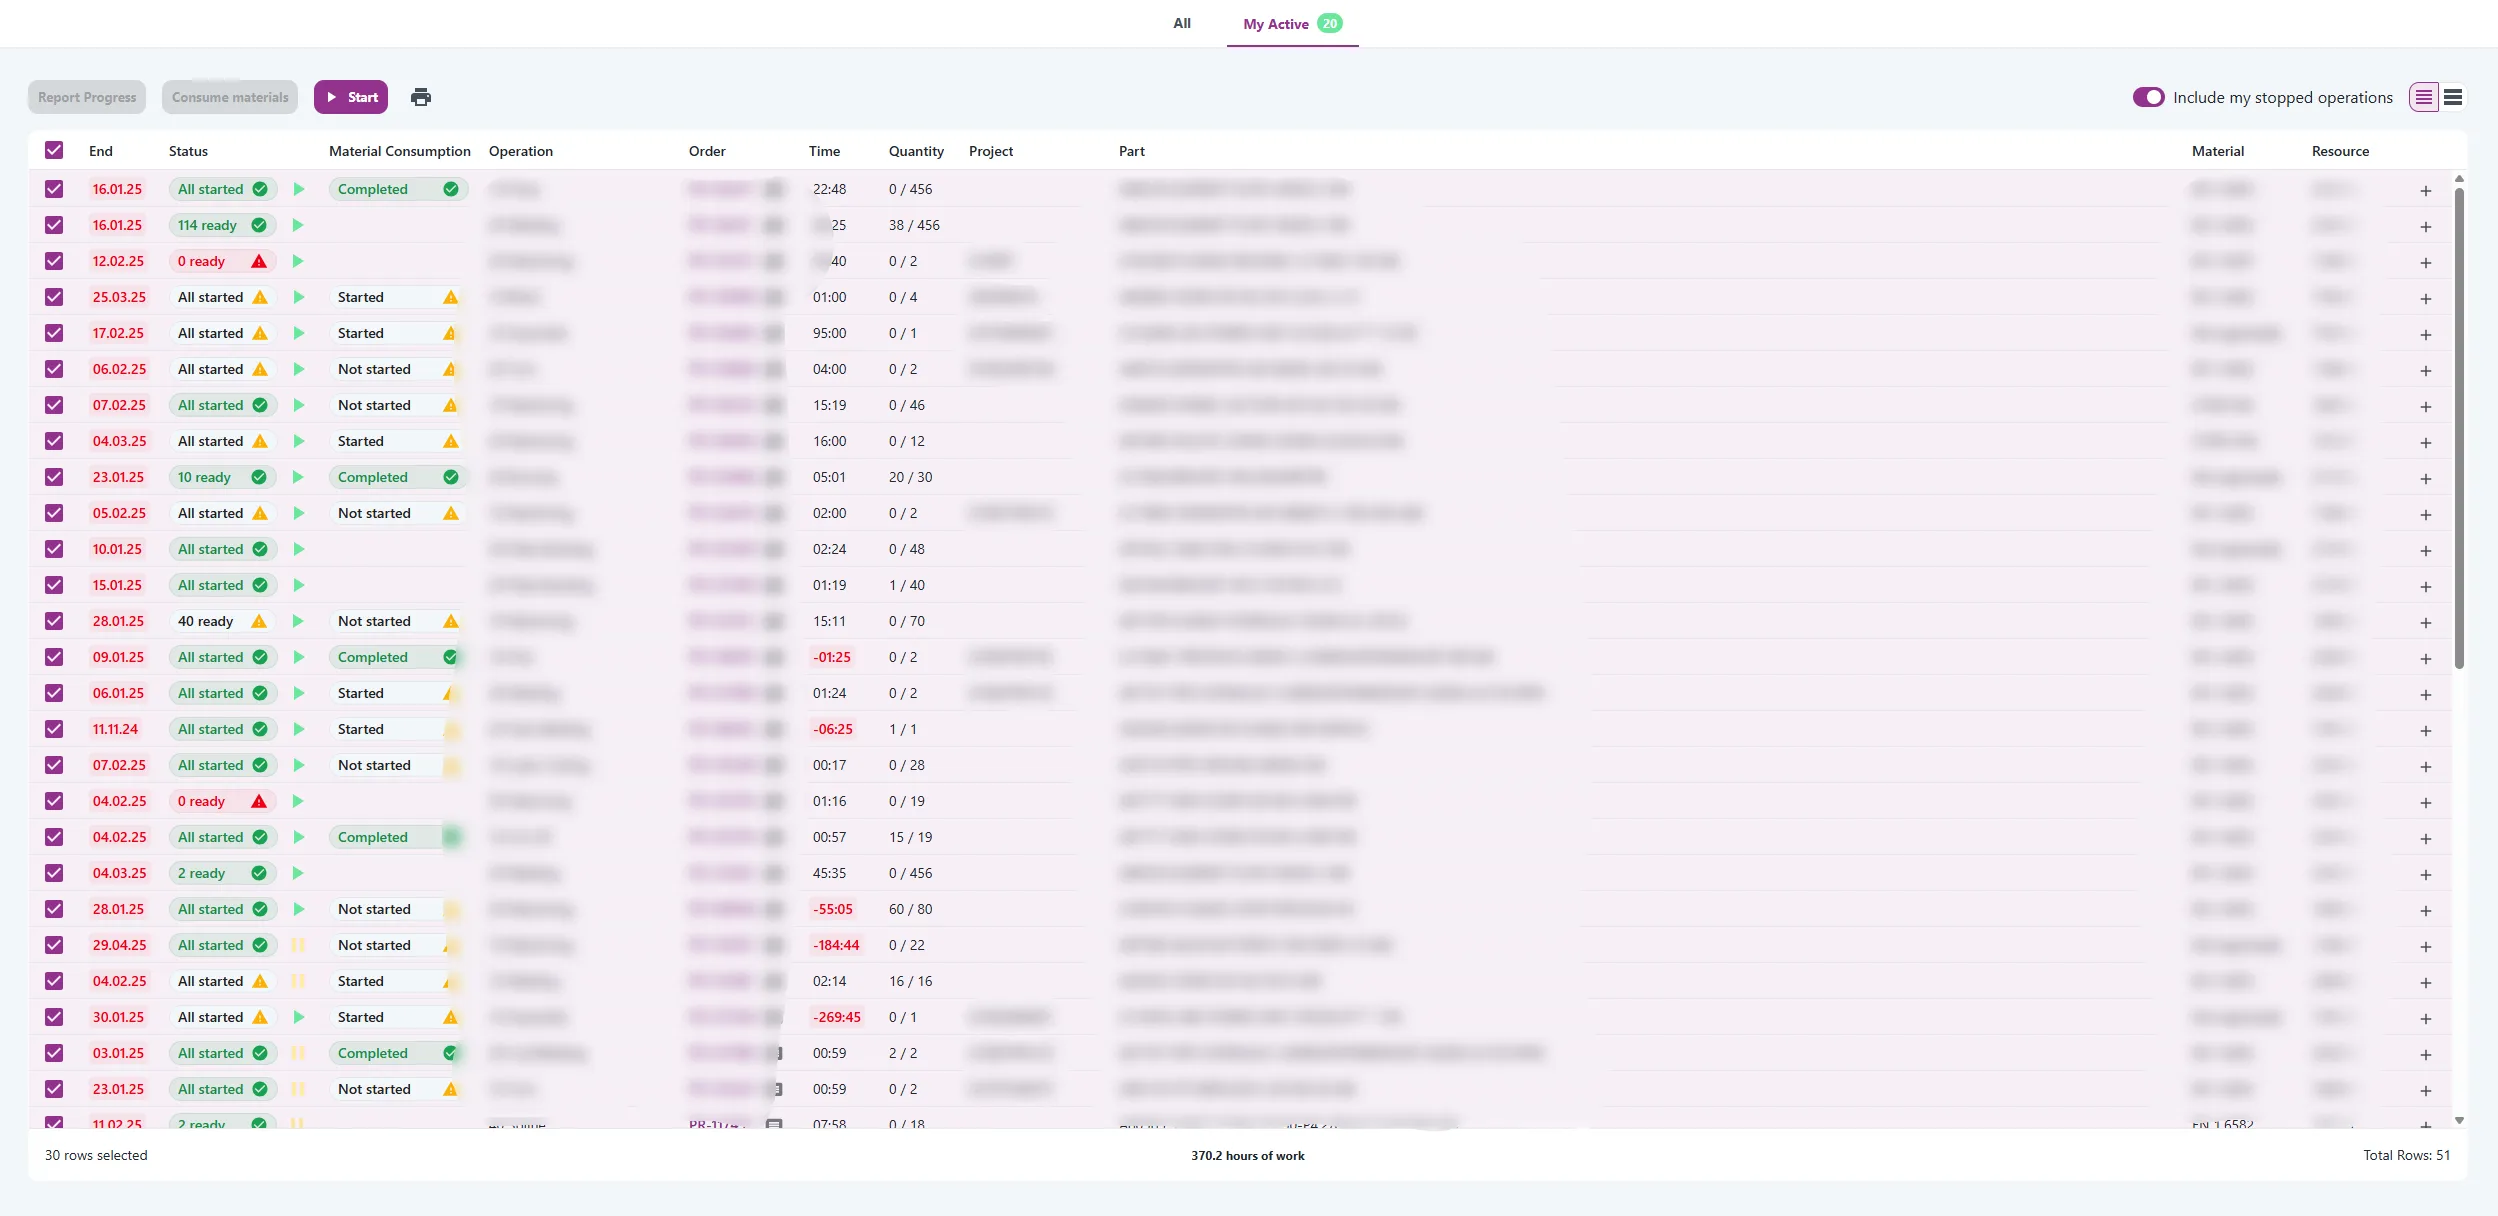
Nå kan du velge flere operasjoner samtidig i My Active-listen. Det gjør det enklere og raskere å håndtere flere oppgaver på én gang. Bruk Select all for å velge de første 30 elementene i listen og gjøre det samme med alle.

engage_my-active_multiselect

Pulse: Ny oppsummering i Current States og Machine Timelines

· Ett min lesetid

Vi har oppdatert oppsummeringen på sidene Current States og Machine Timelines i Pulse. Den gir nå mer innsikt og er mer relevant for den daglige driften.

Viktigste forbedringer​

  • Top Downtime Reasons

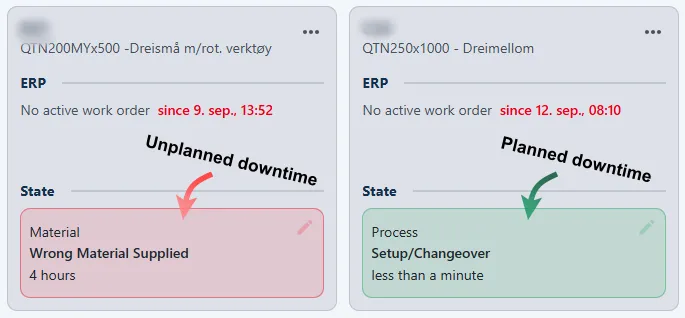
    • Grafen bruker nye farger som skiller tydelig mellom planlagte og ikke-planlagte nedetidsårsaker.
    • I stedet for å vise alle nedetidsårsaker som noen gang er rapportert, viser grafen nå de siste 90 dagene. Da får du et mer oppdatert bilde av hvordan fabrikken presterer.
  • Oppsummeringen for fabrikken følger filtrene

    • Verdiene for ressurser med aktive arbeidsordrer, nåværende maskinstatus og top downtime reasons oppdateres nå ut fra filtrene du har valgt på siden.
    • Før var disse verdiene faste og fulgte ikke filtrene du valgte.

Med disse endringene er det enklere å fokusere på de mest relevante dataene og raskt se trender eller problemer i produksjonen.


Demo:

informasjon om arbeidsordre

Ny sporingsfunksjon og mindre endringer

· Ett min lesetid

Sporing av måleverktøy​

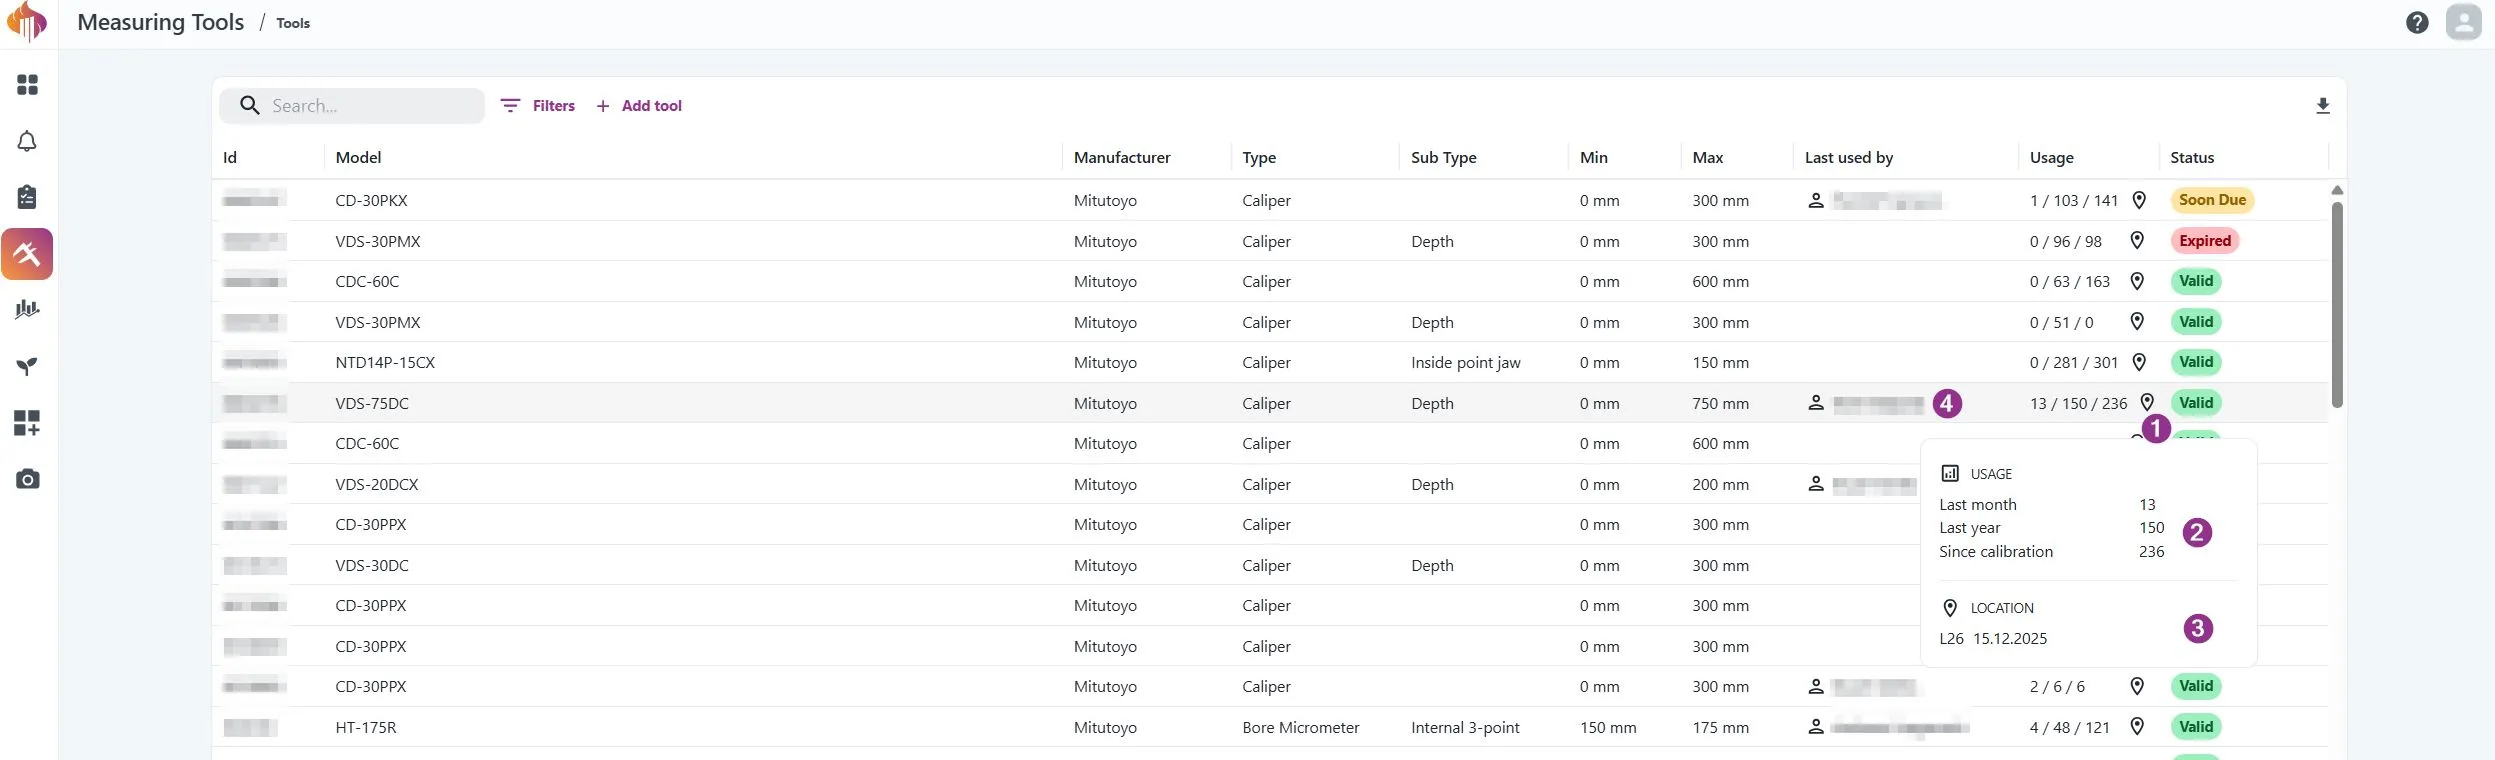
Vi har hatt sporing av verktøy i Measuring Tools helt fra starten. Nå er sporingen fornyet og utvidet med en nyttig funksjon: du ser hvem som sist brukte verktøyet, i kolonnen Last used by.

Forbedringen er laget for kunder som ikke har ERP-integrasjon mot Inspect. Tidligere viste sporingen bare den siste kjente lokasjonen til verktøyet, og den var helt avhengig av data fra ERP.

Sporing av måleverktøy i Measuring Tools

Forklaringer

1: Hold musepekeren over nålen for å se hvor mye verktøyet er brukt, og hvor det sist var (Usage og Location).
2: Viser hvor mange ganger verktøyet er brukt. Verdien oppdateres hvert 10. minutt, ikke umiddelbart.
3: Lokasjonsdata er bare tilgjengelig for kunder med ERP-integrasjon.
4: Viser navnet på den siste operatøren som brukte verktøyet (ℹ️ hold musepekeren over navnet for å se tidspunktet).

Tool editing updates and new tab option

· Ett min lesetid

Improved tool editing and deletion​

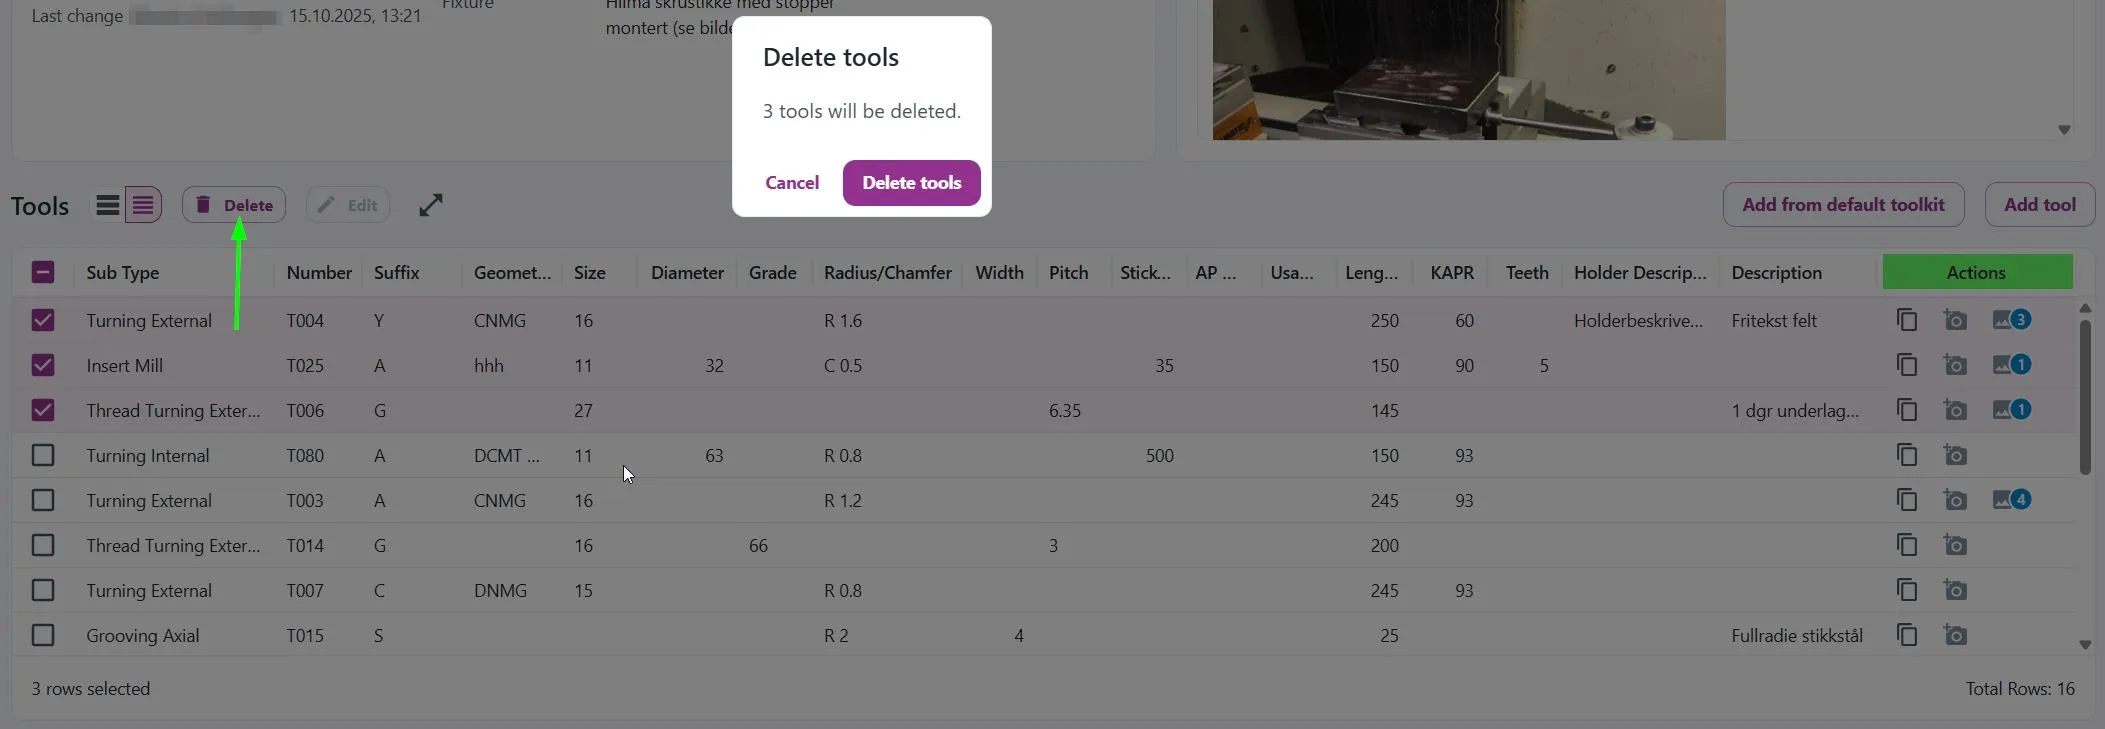
You can now multi-select tools in the Compact density view to delete several at once.
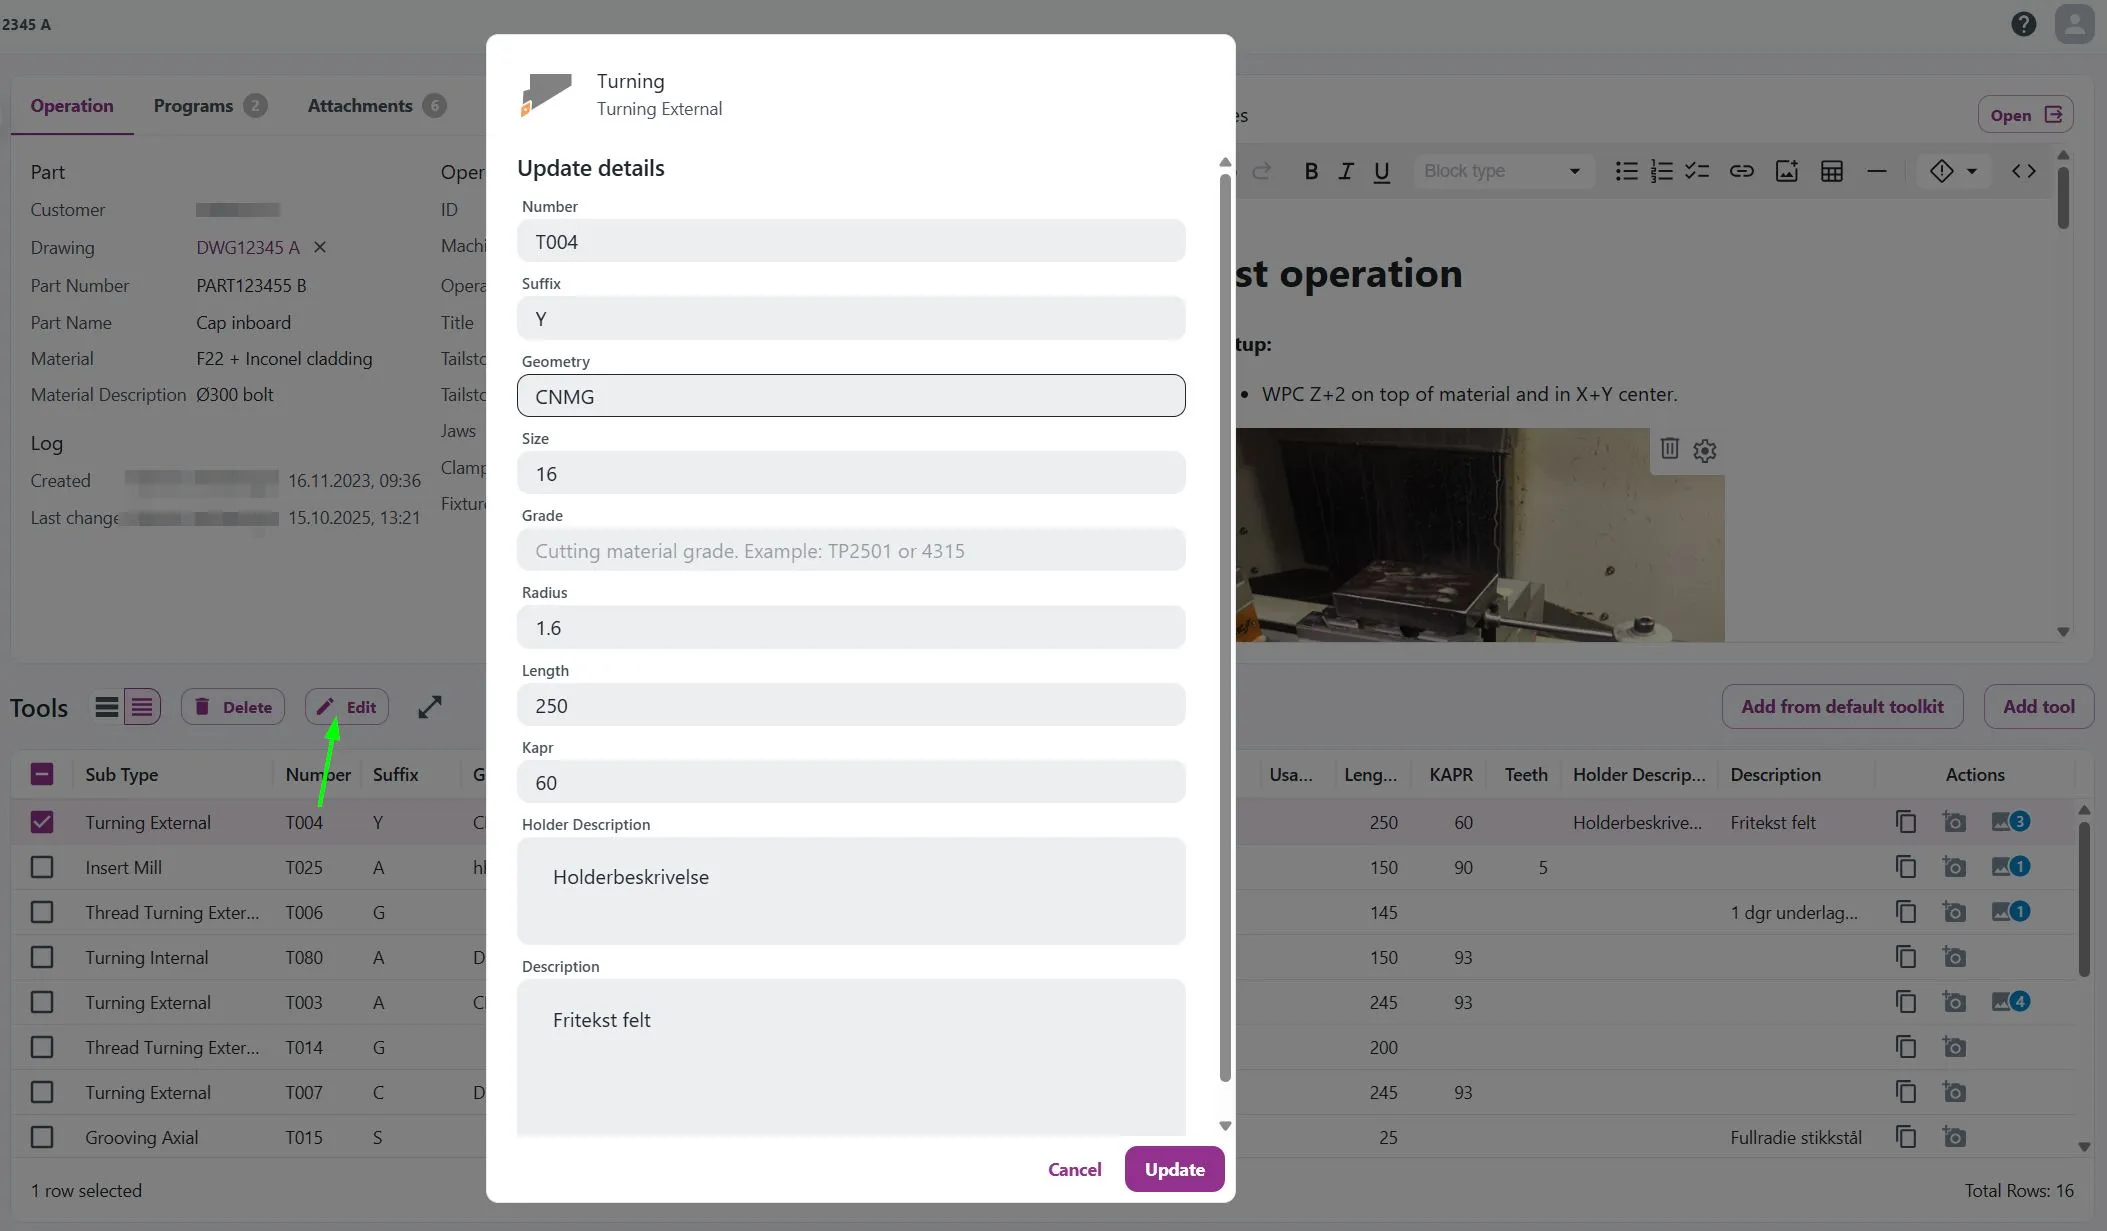
It’s also possible to open the Edit dialog instead of editing directly in the table.

merknad

The Edit dialog is available only when a single tool is selected.

multi-delete1 Notice that the Delete button in the actions column has been removed. Use the new Delete button instead.

multi-delete2

Coming soon: Open operations in a new tab​

new-tab-operations You’ll soon be able to open an operation in a new browser tab.

Export booking and parcel list in Move

· Ett min lesetid

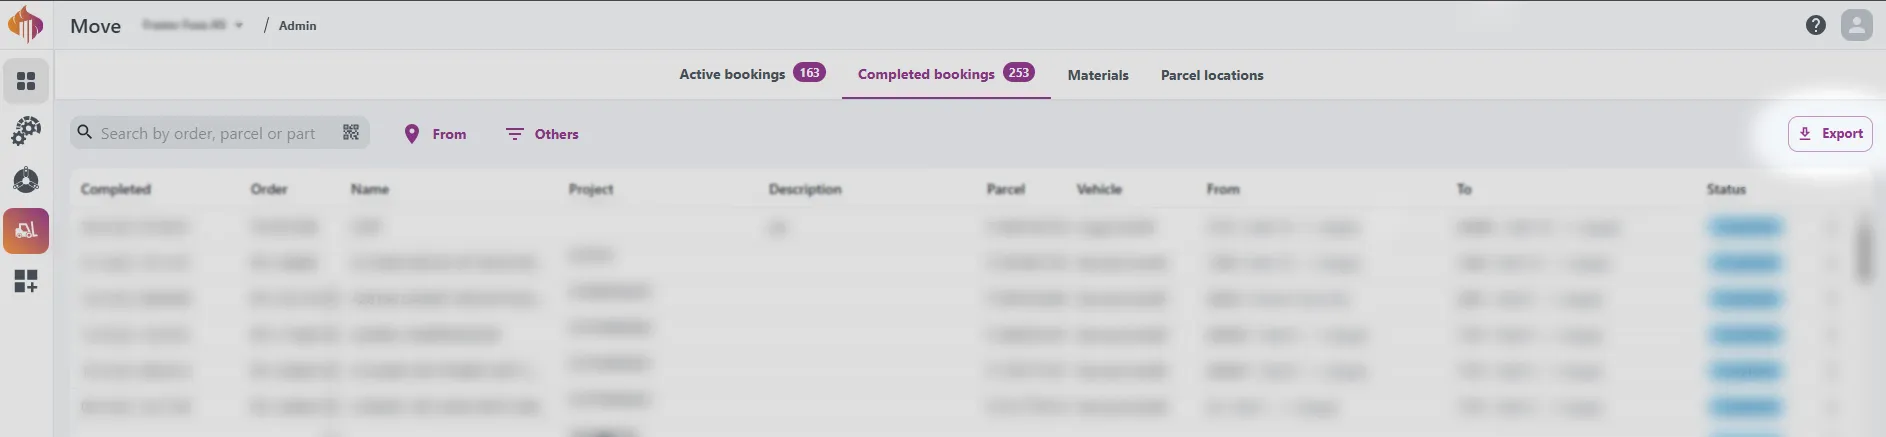
We're happy to introduce a new Export button in Move Admin! You can now easily export data from the following tabs:

  • Active bookings
  • Complete bookings
  • Parcel locations

Available export options include:

  • Booking list (with or without tracking)
  • Parcel list

All exports are provided as JSON files for easy integration and analysis.

Here’s how it looks in the UI:

move_admin_export_btn

move_admin_export_button

Easier Downtime Reporting in Machine States

· Ett min lesetid

We have made it even easier to report and notice active Downtime Reasons in Machine States!

The resource card on the Machine States overview now has a dedicated Report Downtime button at the bottom. This makes it possible to report downtime for all resources. By clicking this button, you can start reporting downtime reasons just like in our report downtime widget in Workspace.

work order toggle desktop

Here is a demo: work order toggle mobile

Resources that have active downtime reports will display a marker.

work order toggle desktop

You can easily end or edit active downtime reporting by clicking the downtime report marker and pressing the stop button or checking/unchecking the "End downtime reporting when the machine state changes" option.

work order information

Material Booking

· 2 min lesetid

We are happy to introduce a new type of booking for our Move and Engage users: Material Booking! Now you can make a Move booking for material lines in Engage from the Materials and Consume Materials dialogs.

consume_booking_button Material lines with available quantity are now selectable and can be booked by using the booking button in the top corner.

Demo of how you create material bookings

material_booking_demo

  1. From the Materials or Consume Materials dialog in Engage, select the material lines you want to create a booking for by marking the select button to the left of the line.
  2. Click the Move icon in the top right corner.
  3. Adjust preferred locations, quantity, and description in the form.
  4. Click Book and voilà: Your booking will appear like other Move bookings for transporters to pick up.

Output in Move

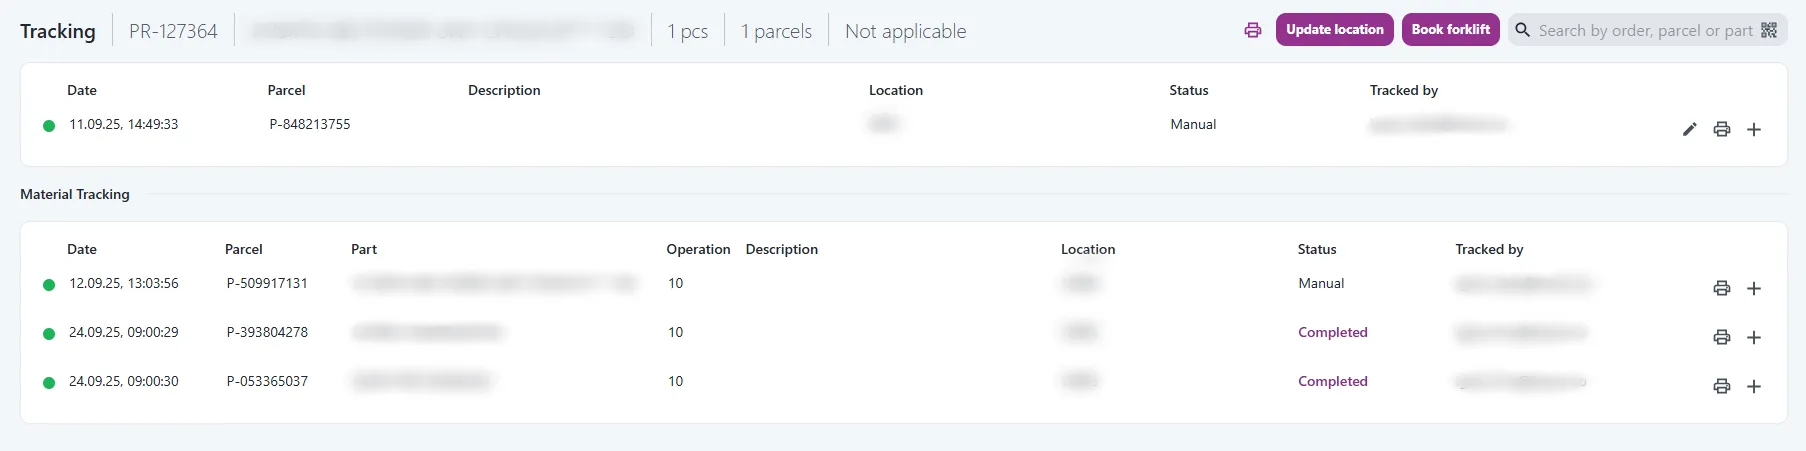
Material bookings are marked with an M throughout Move. The part information and quantity follows the material line and not the production order. A new table containing material bookings is added for related production orders in tracking.

driver_material_booking_cards Output in Driver.

material_booking_tracking Output in Tracking

Active booking marker

Material lines with bookings in status complete, pending, or in progress get a booking status marker. Hovering over this will give more information about the booking.

material_booking_status

Example shows material lines with active bookings in status Pending.

New Utilization Methods

· 2 min lesetid

We’ve expanded Pulse with two new utilization methods:

  • Machine Capacity utilization (OEE)
  • Calendar Capacity utilization (OOE)

Examples​

Machine Capacity utilization (OEE)​

Machine Capacity utilization calculates how effectively a machine is used compared to its planned daily capacity.
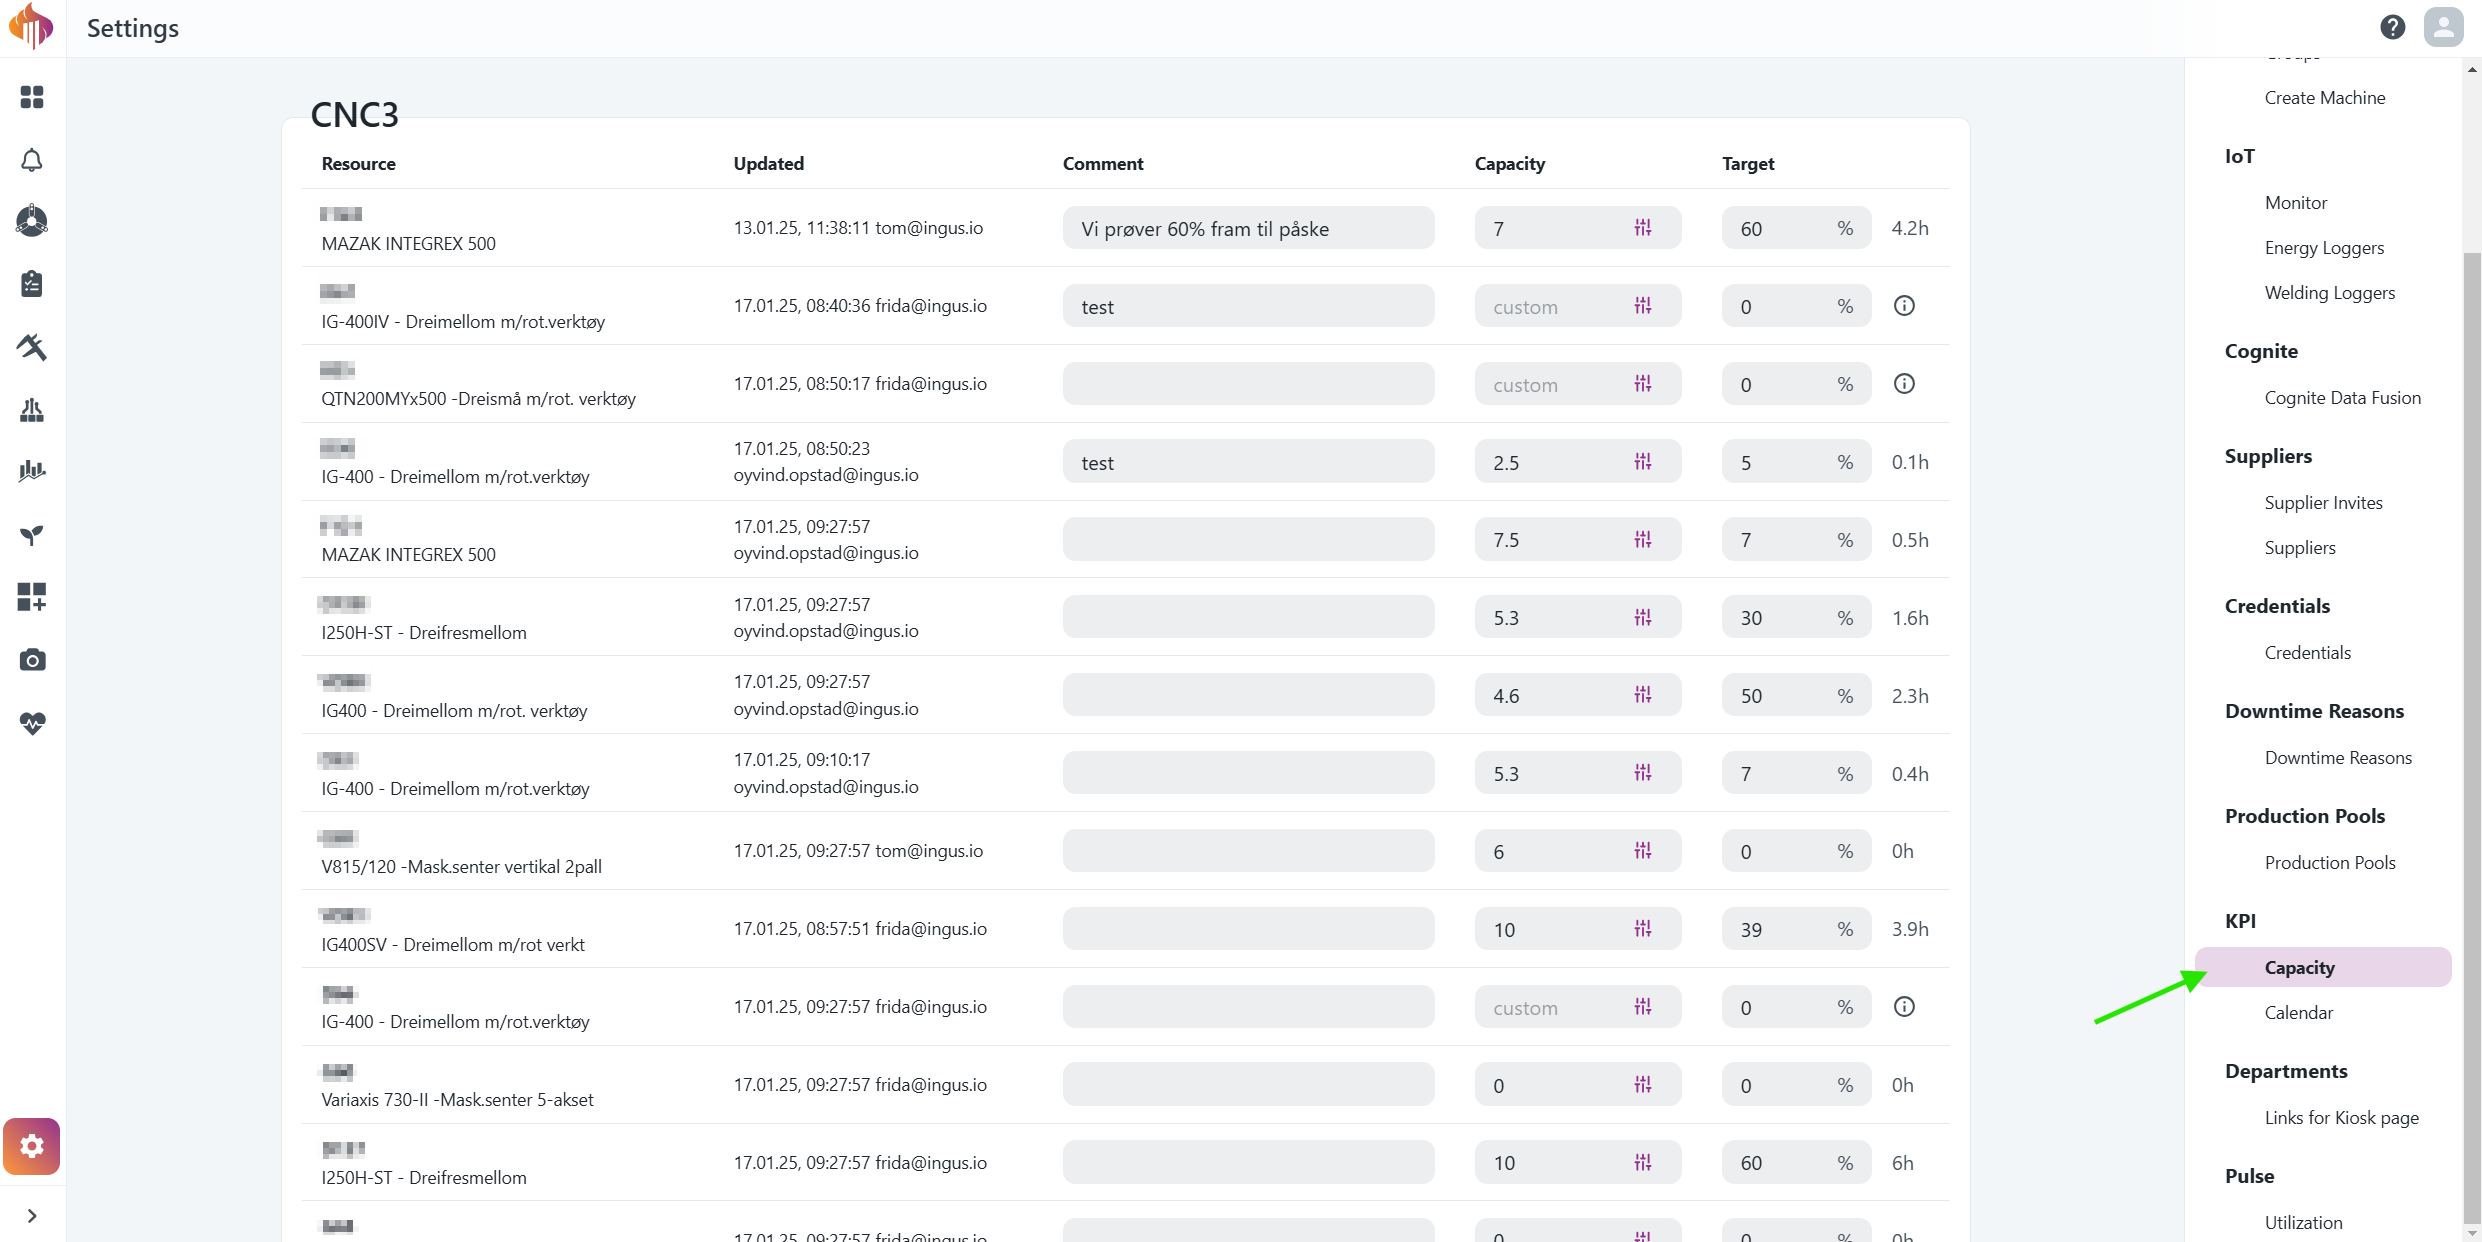
Admins can dynamically configure the daily capacity for each machine.

For example:
If a machine has its Monday capacity set to 8 hours, and its uptime is 4 hours, the utilization will be 50%.
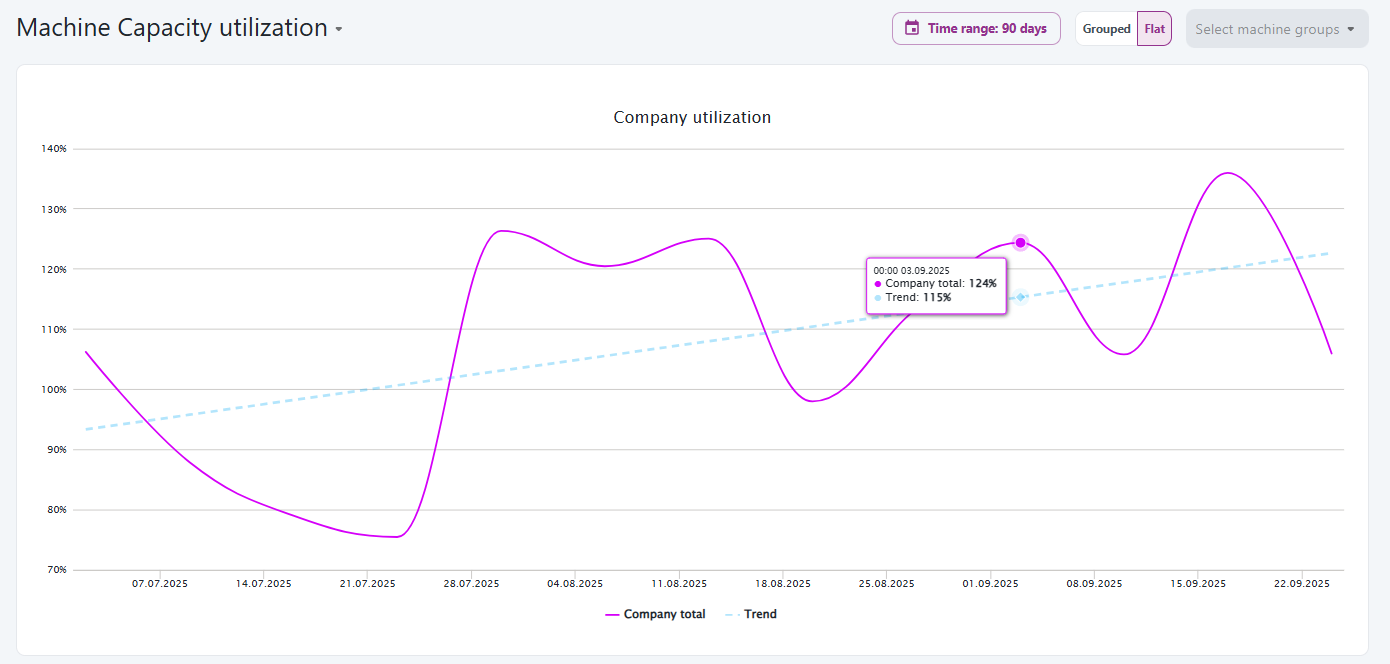
machine-capacity-graph

In systems where Performance and Quality values are available, the OEE calculation will include them. When these values are not provided, they are automatically set to 100%, meaning OEE effectively reflects Availability.

machine-capacity-table

💡 Admin Tip:
Be careful when assigning very low capacity values (for example, 0.1 h) to weekends or non-production days. If the machine runs even briefly on those days, utilization can spike to unrealistic levels (thousands of %). Set capacity to 0 h for days with no planned production to avoid distorted results.


Calendar Capacity utilization (OOE)​

Calendar Capacity utilization calculates how effectively a machine is used compared to the company’s planned calendar capacity.
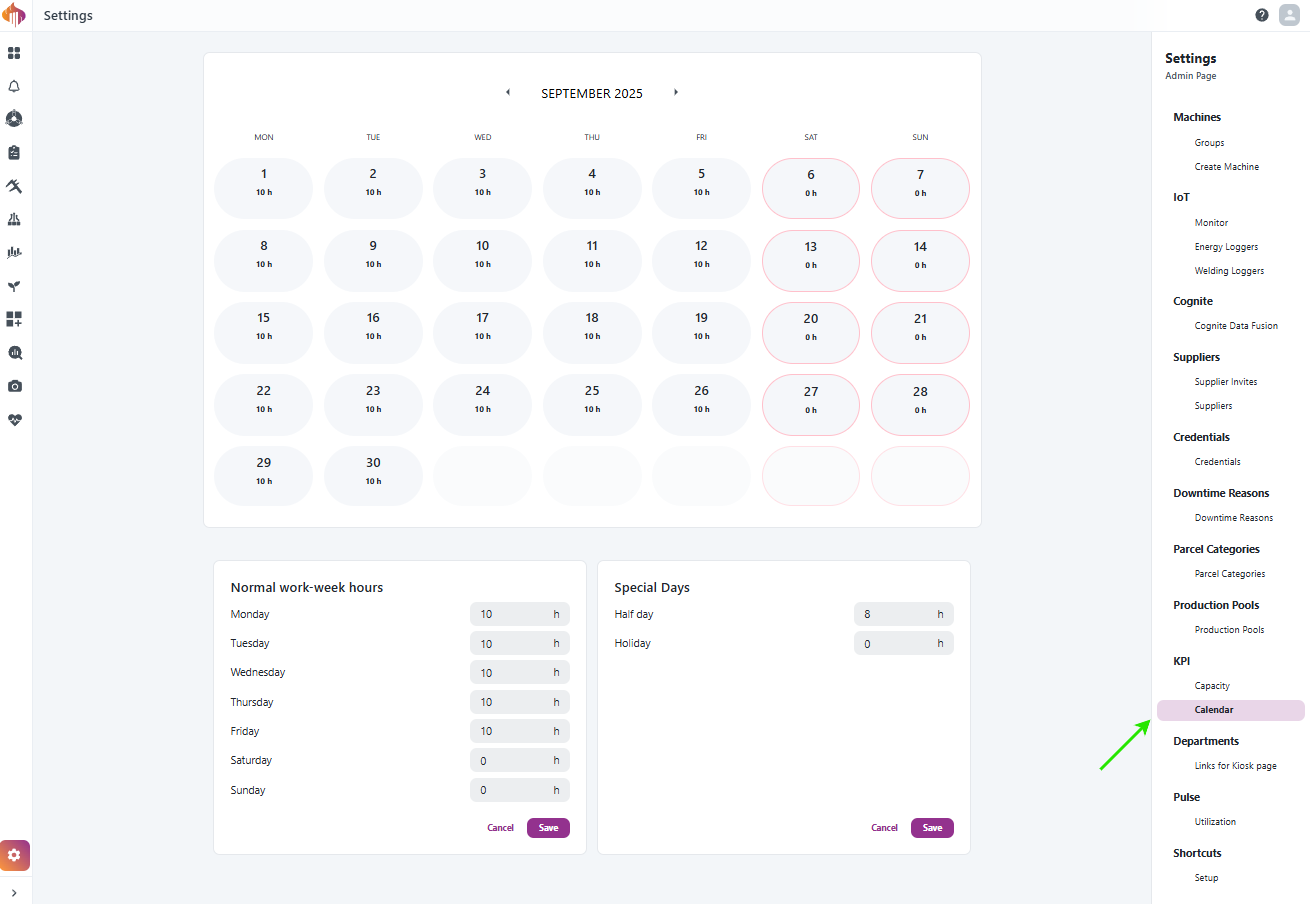
Admins can dynamically configure the calendar capacity.
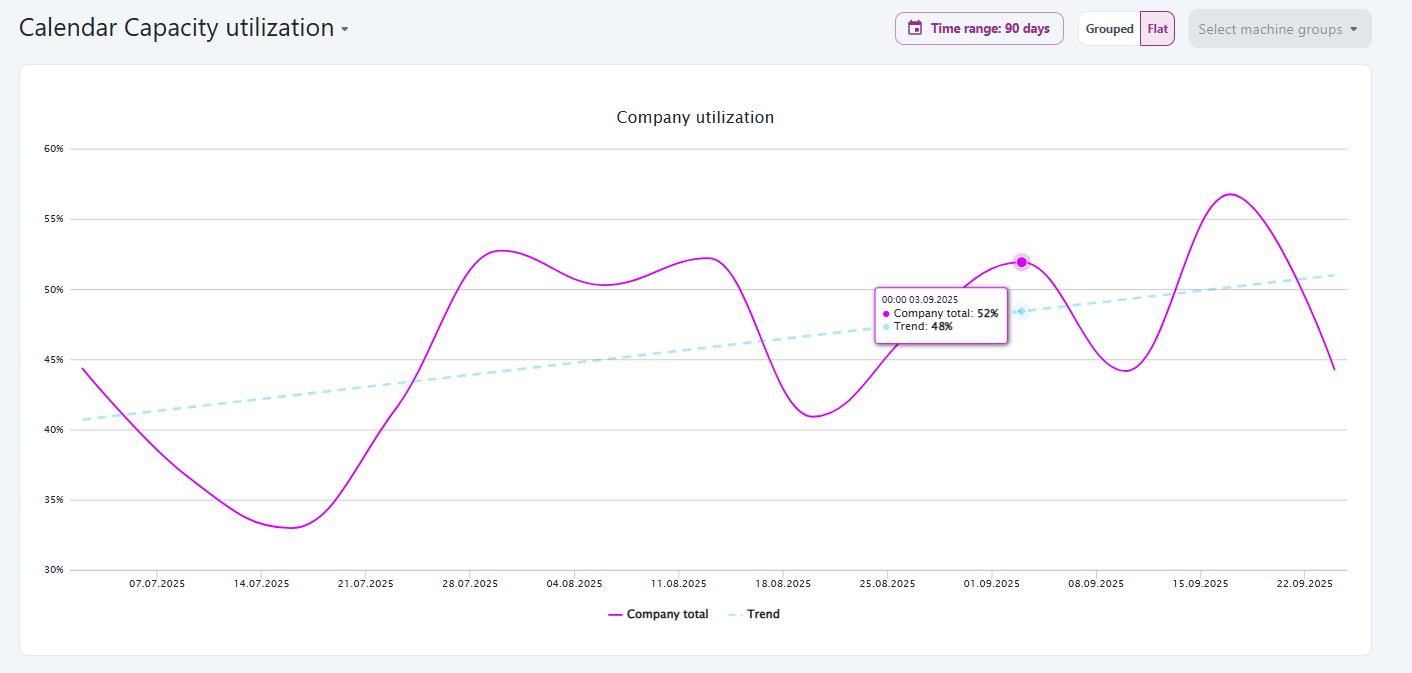
calendar-capacity-graph

Just like with OEE, in systems where Performance and Quality values are available, the OOE calculation will include them. When these values are not provided, they are automatically set to 100%, meaning OEE effectively reflects Availability.

calendar-capacity-table


Machine Capacity settings for Admins​

capacity-admin

Factory Calendar settings for Admins​

factory-calendar

Fixed Y-Axis for Utilization Graphs

· Ett min lesetid

We’ve improved the readability of utilization graphs by introducing a soft maximum of 100% on the Y-axis.

What’s new​

  • When utilization values are below 100%, the Y-axis is locked at 100% for easier comparison across different insights.
  • When utilization values exceed 100%, the Y-axis dynamically adjusts beyond 100% to fit the data.
  • This ensures more consistent scaling when comparing Power-on, 24/7, Factory Calendar, and Machine Calendar utilization insights.

Example​

fixed-y-axis-utilization-graph

The Y-axis stays consistently locked at 100% until utilization values go beyond 100%, at which point the axis automatically adjusts.