What's new in IGNOS Pulse?
March 10, 2025
During the last few weeks, we've released several updates for Pulse!
Below is a summary of what's new.
Table of Contents
Utilization Insights surface
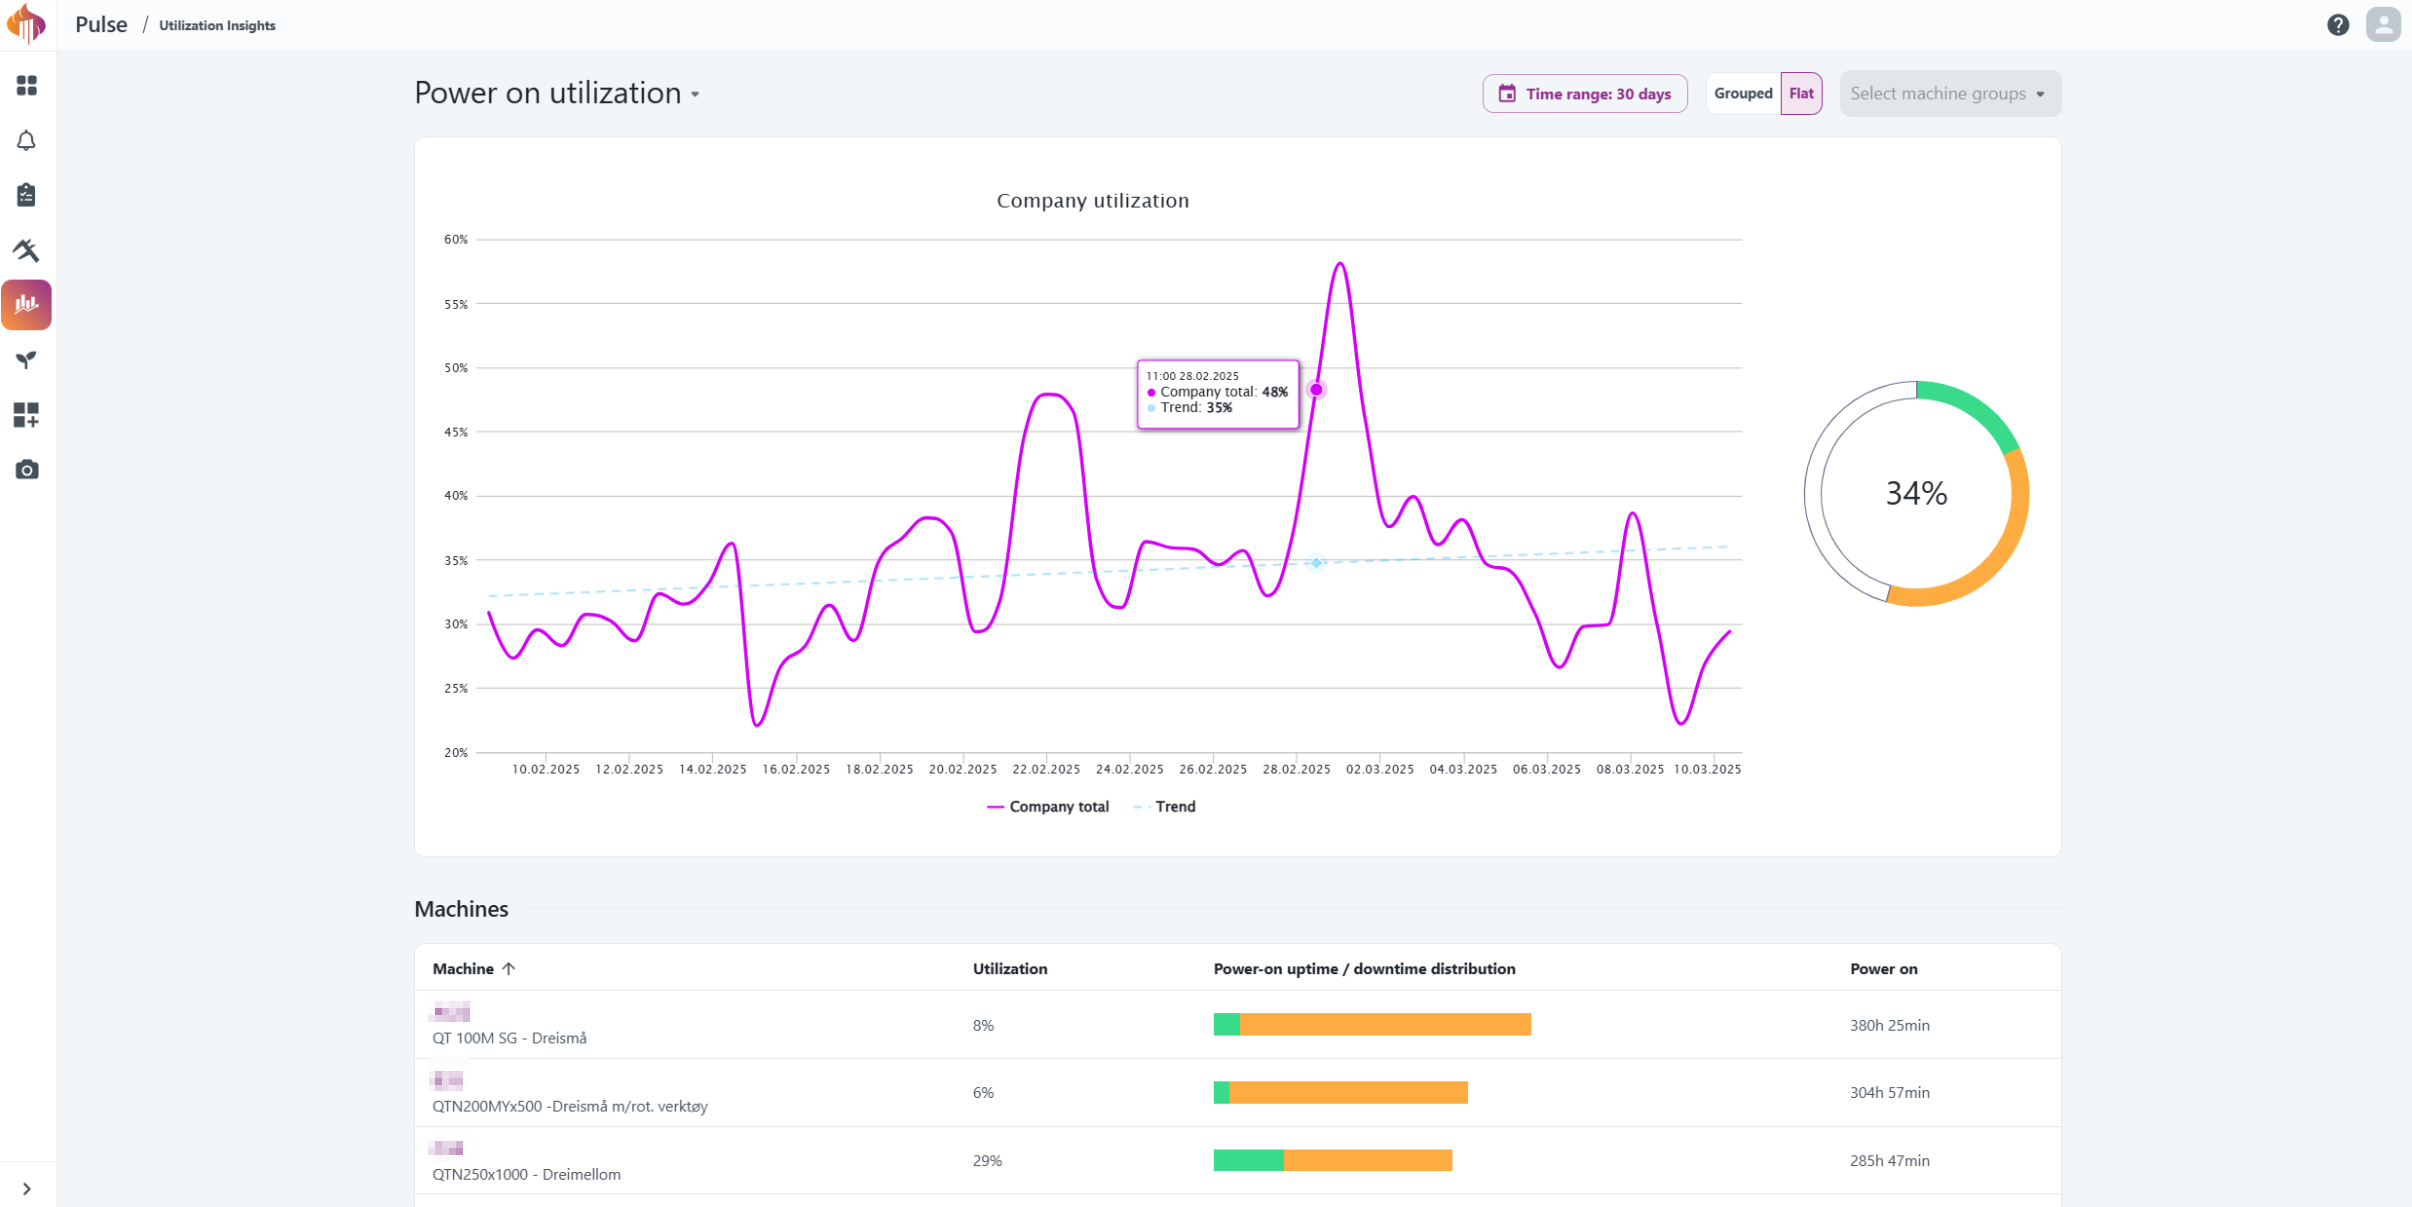
📈 New: A new surface for Utilization Insights is now available!
The new surface provides better visibility into utilization trends.
Downtime Reasons reporting
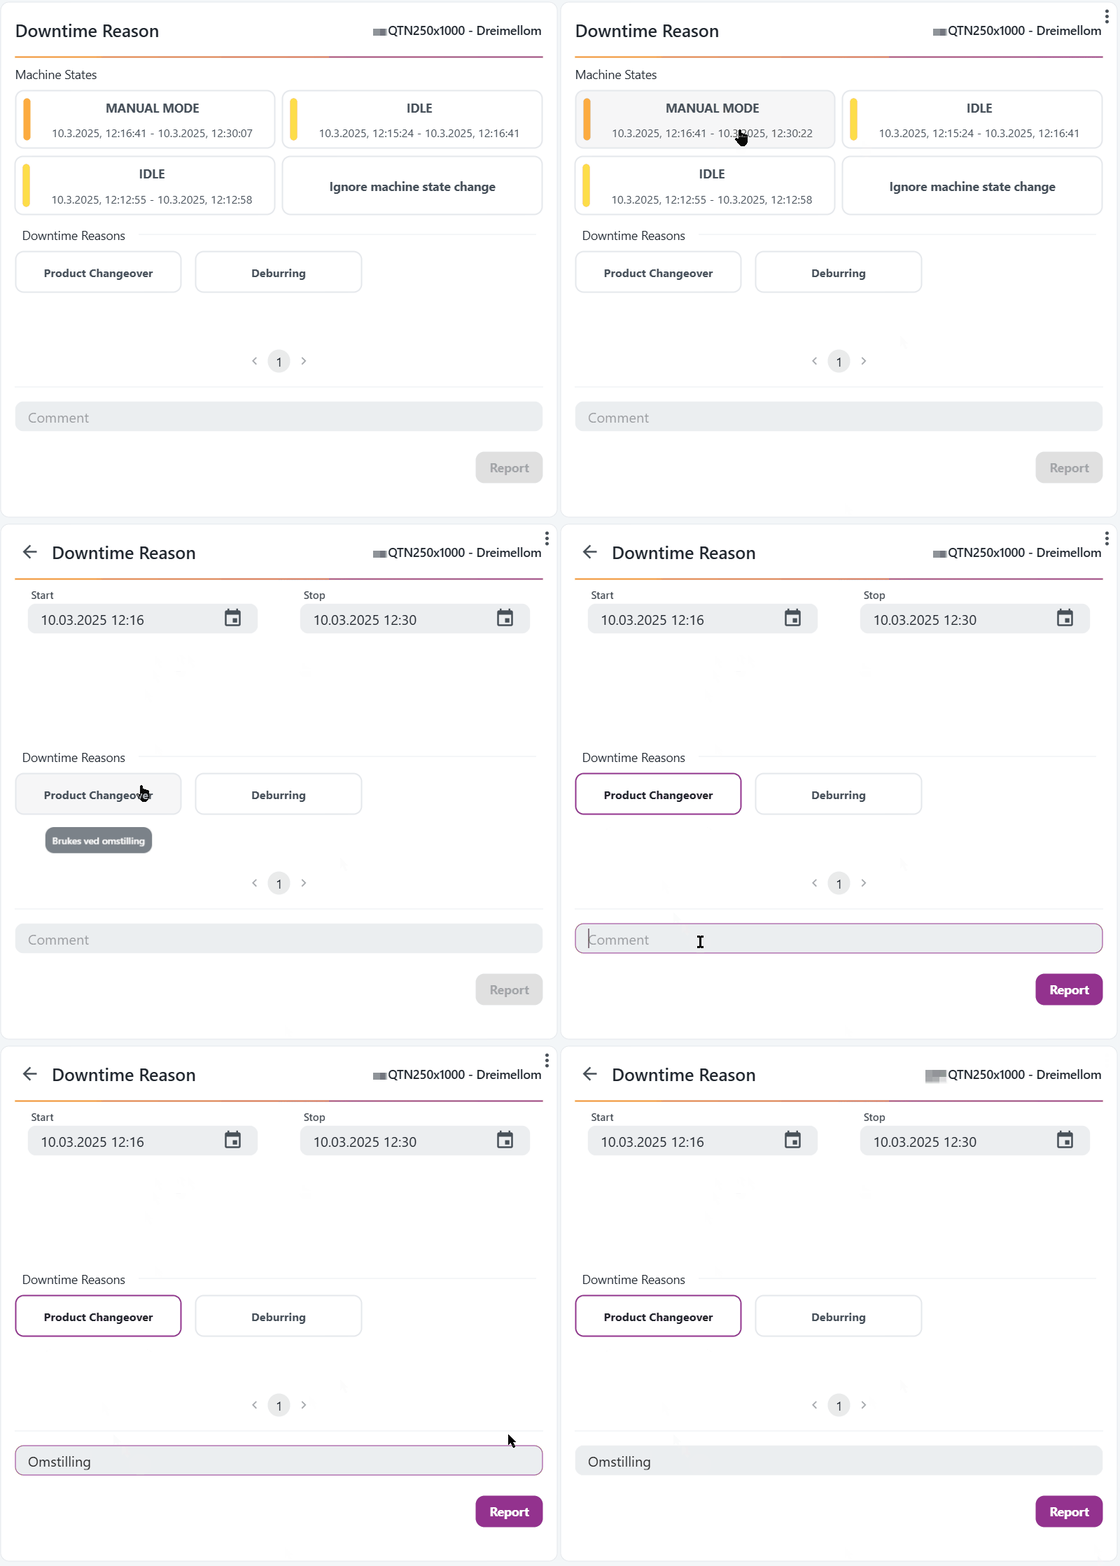
We've introduced two ways to report downtime reasons:
✍️ Through the Machine State Timeline
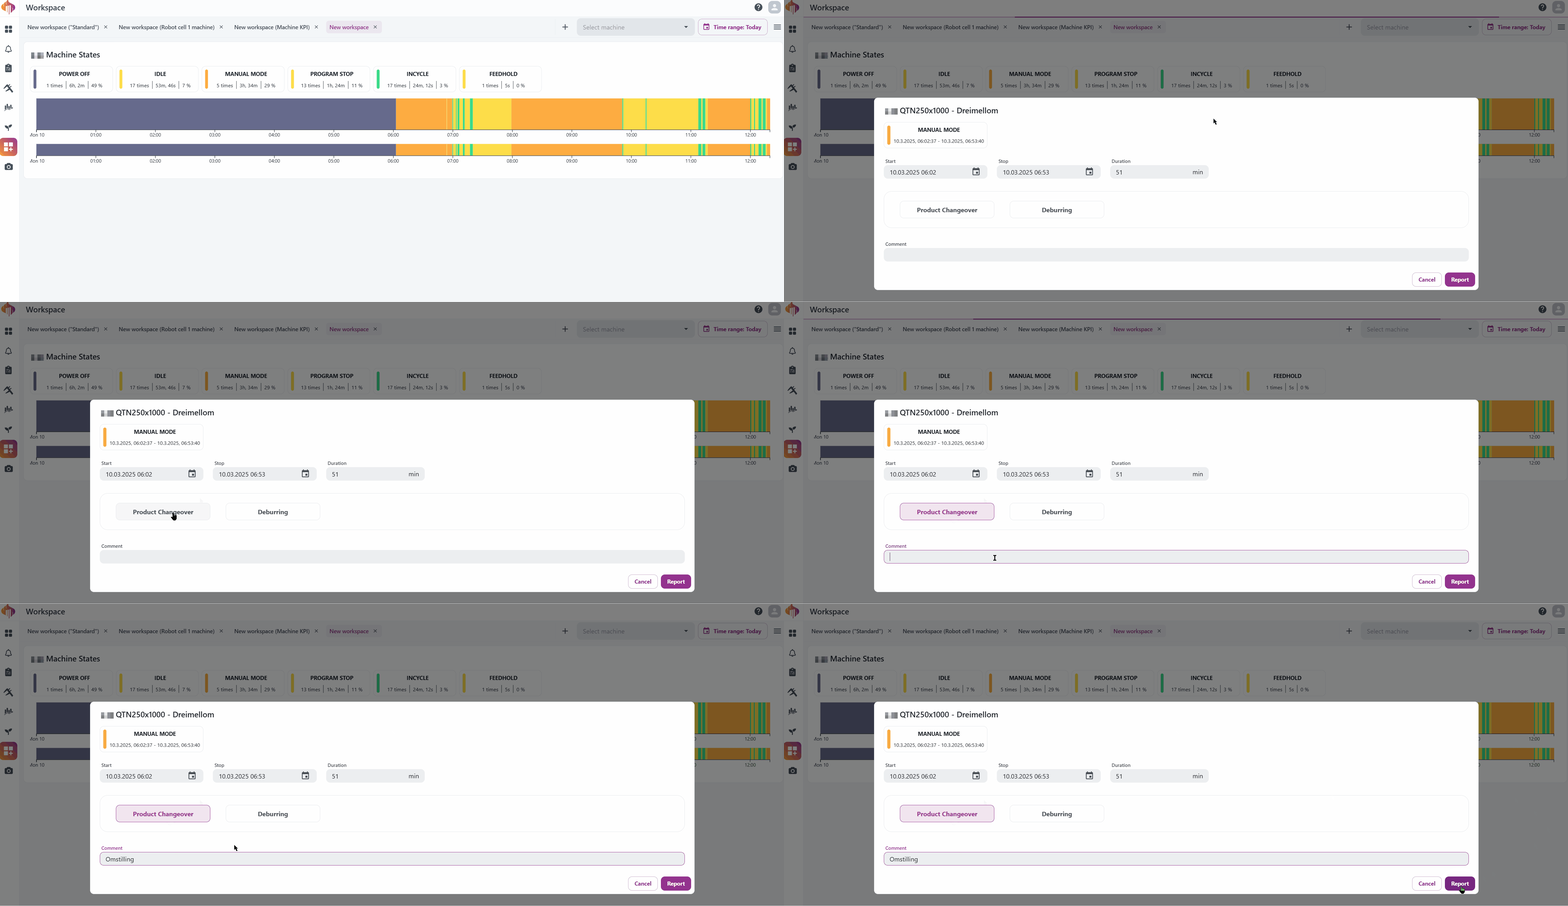
✍️ Through the Downtime Reason Widget
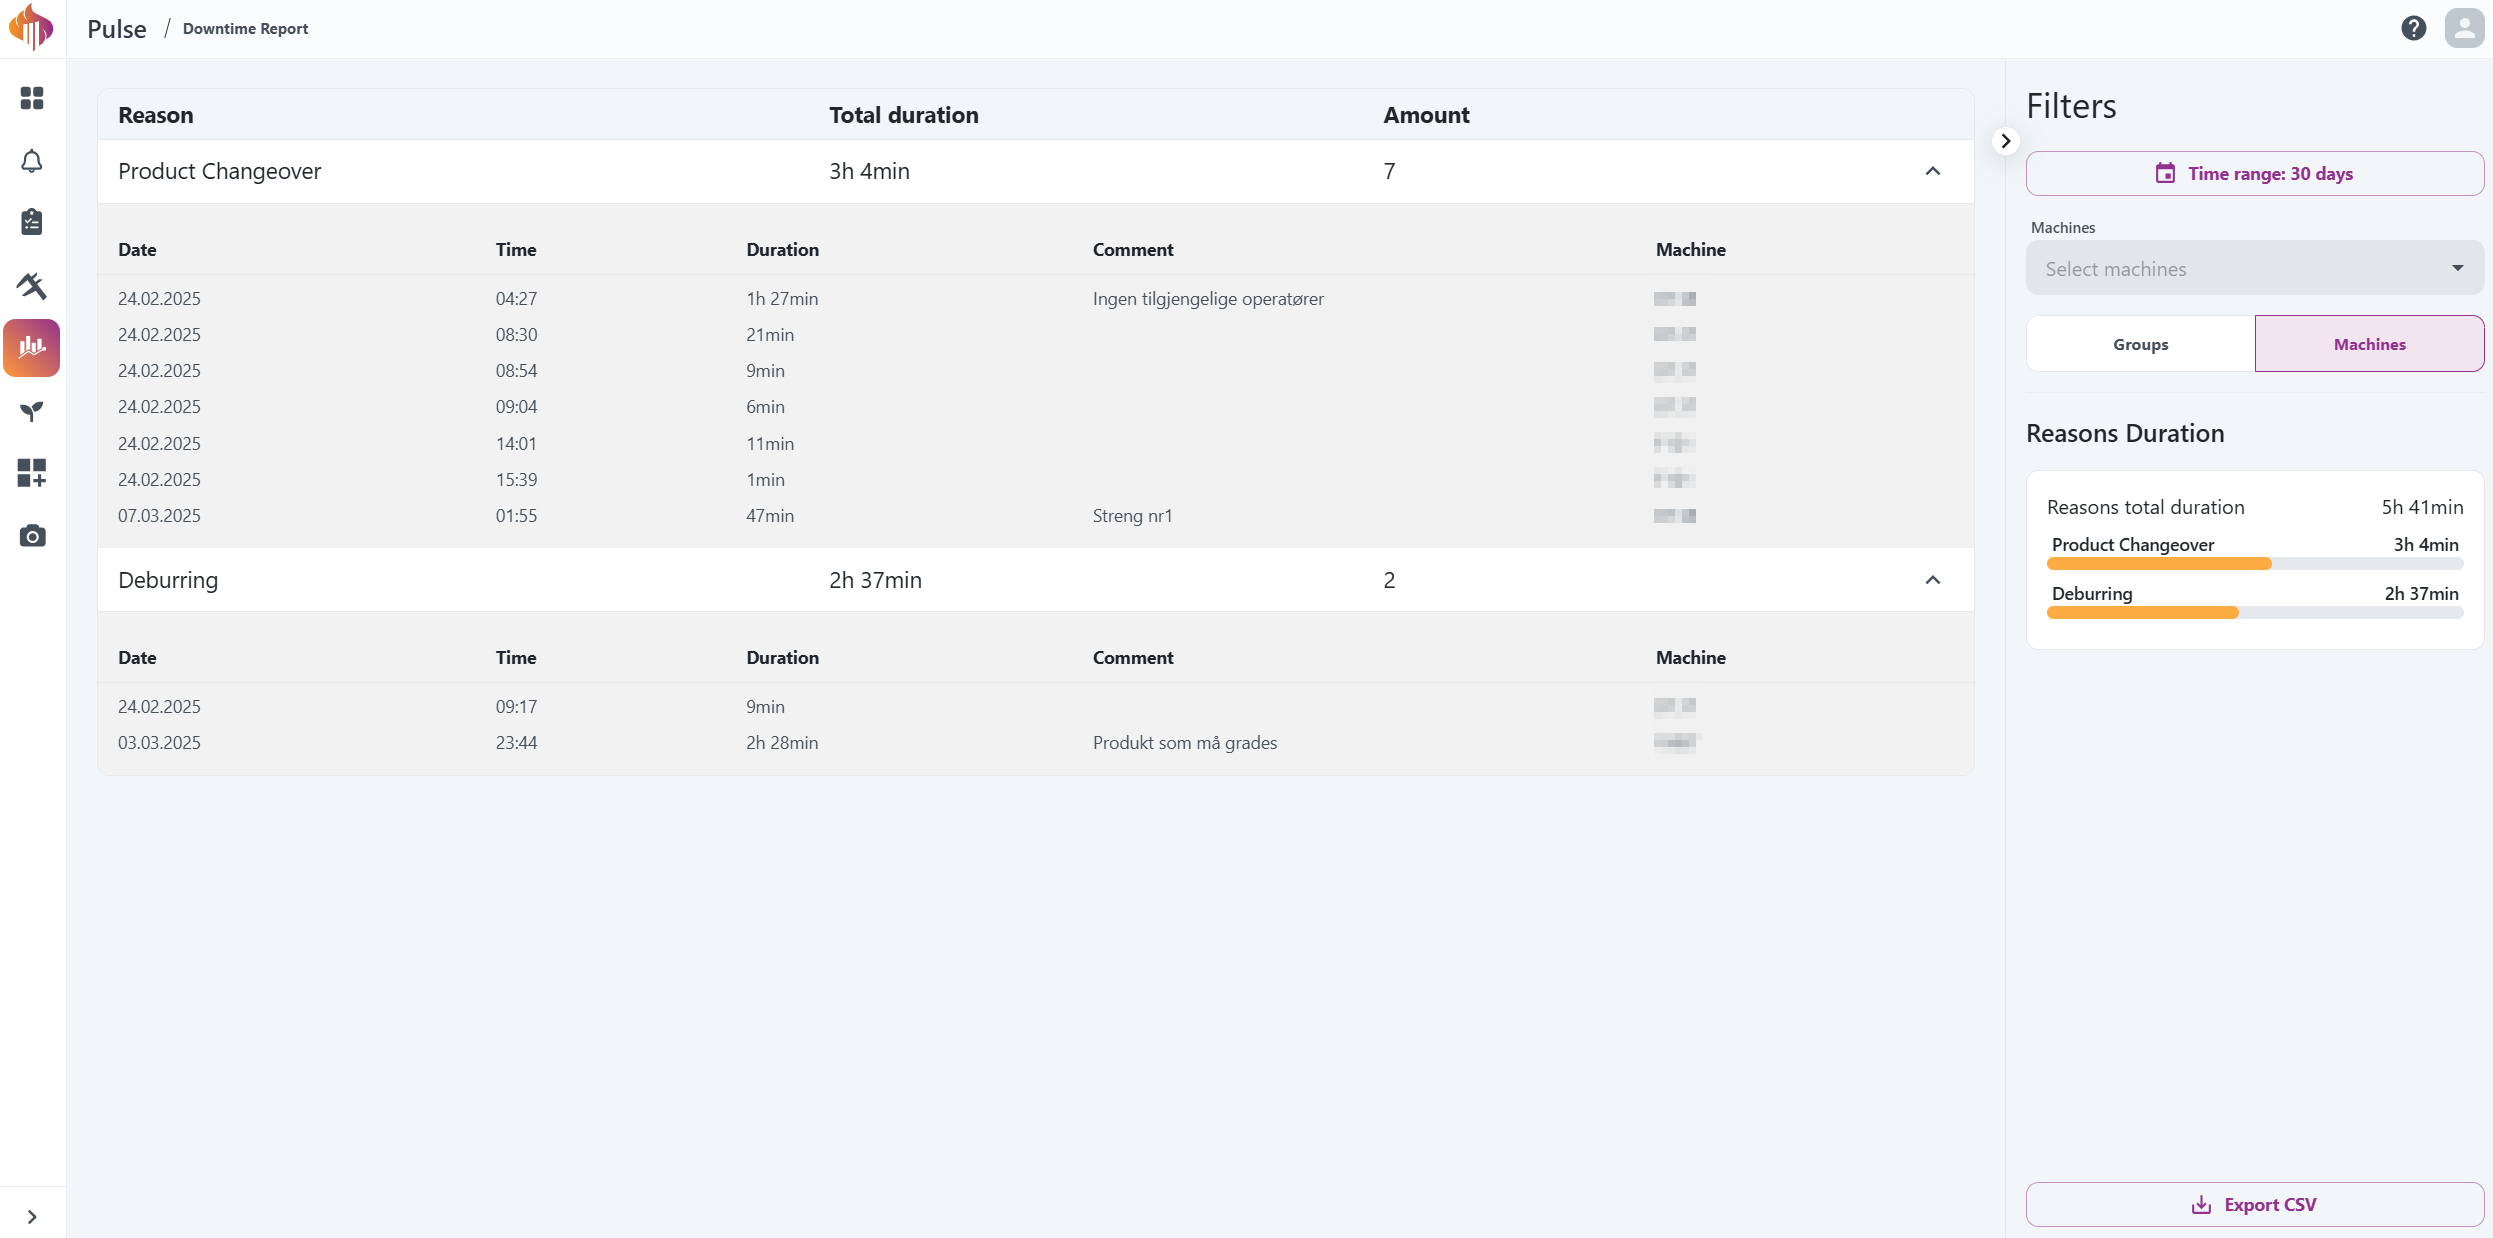
Downtime Report
The Downtime Report gives deeper insights into the duration of all reported downtime reasons.
New Workspace Widgets
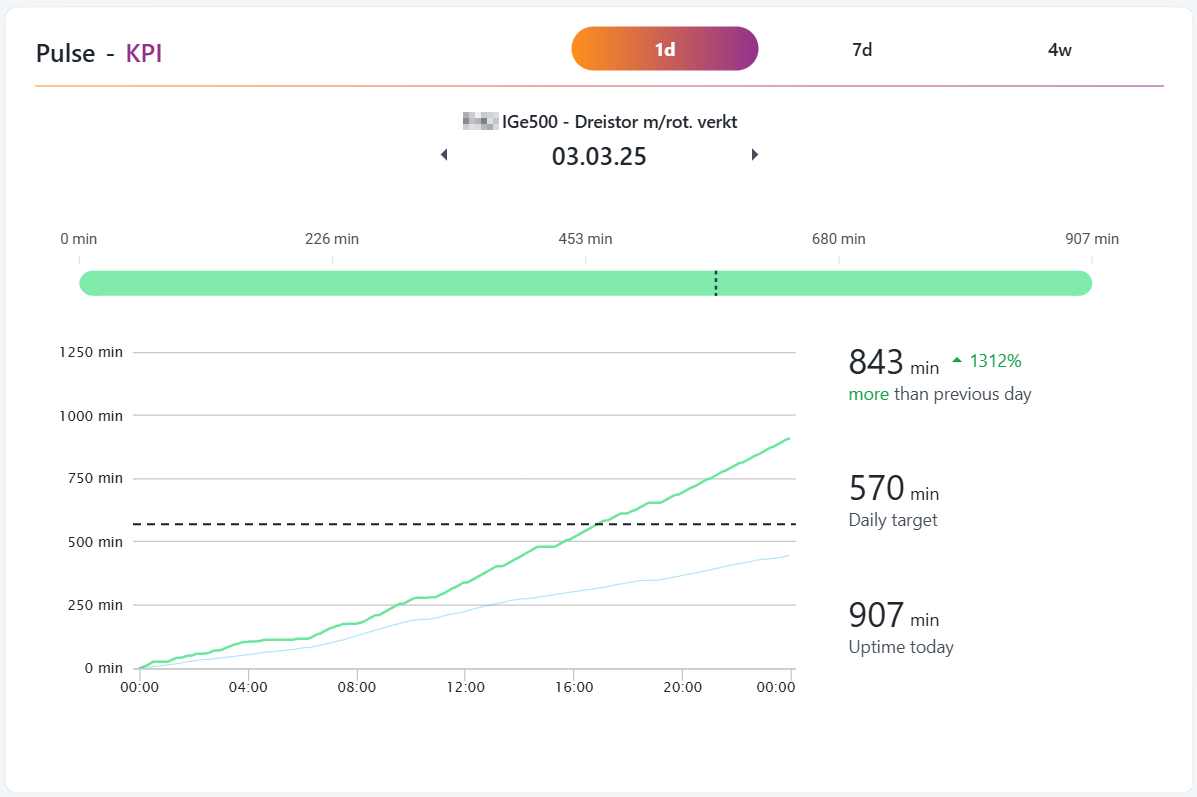
Two new widgets are now available from Workspace:
- Pulse KPI Widget
- The Downtime Reason reporting widget mentioned above
These updates have now been live for a couple of weeks! Try them out if you haven't already and let us know what you think!
October 23, 2024
We’re happy to announce that Utilization has a fresh new name: Pulse! 🙌
But that’s not all!
Exciting updates are on the way. We’re giving the app a facelift along with other improvements.
Stay tuned for more details soon!
December 5, 2023
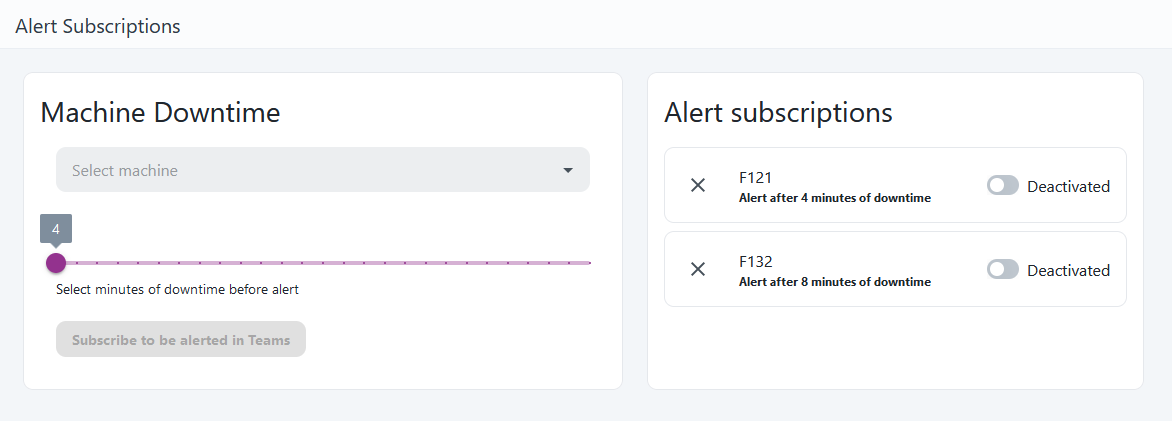
Alert Subscriptions for Unattended Machining
When running unattended machining jobs the operator may want to actively be notified on their phone if the machine stops for any reason. Notifications is a better alternative than requiring an operator actively having to check in with the machine to see if it is still running.
Before you can start using the feature, an IT admin needs to install the teams bot: Teams bot installation guide
How does it work
A Teams app is installed to the customer Teams. There it will synchronize the Teams users to our database and allow a bot to send messages to individual operators.
- The operator starts a machine for unattended machining.
- The operator adds an alert subscription for the machine.
- If the machine is inactive for the period specified, a notification is sent to the operator via Teams.
- When the operator returns to work they can disable the subscription to stop receiving messages.
Notification behavior
- The machine is considered active when it is in an active machining cycle. It is otherwise considered inactive if for example the machine is in Manual mode, in alarm state or powered off.
- After you’ve received a notification you will not receive another notification until the machine has returned to an active state again.
November 2, 2023
Show or hide active work order operation
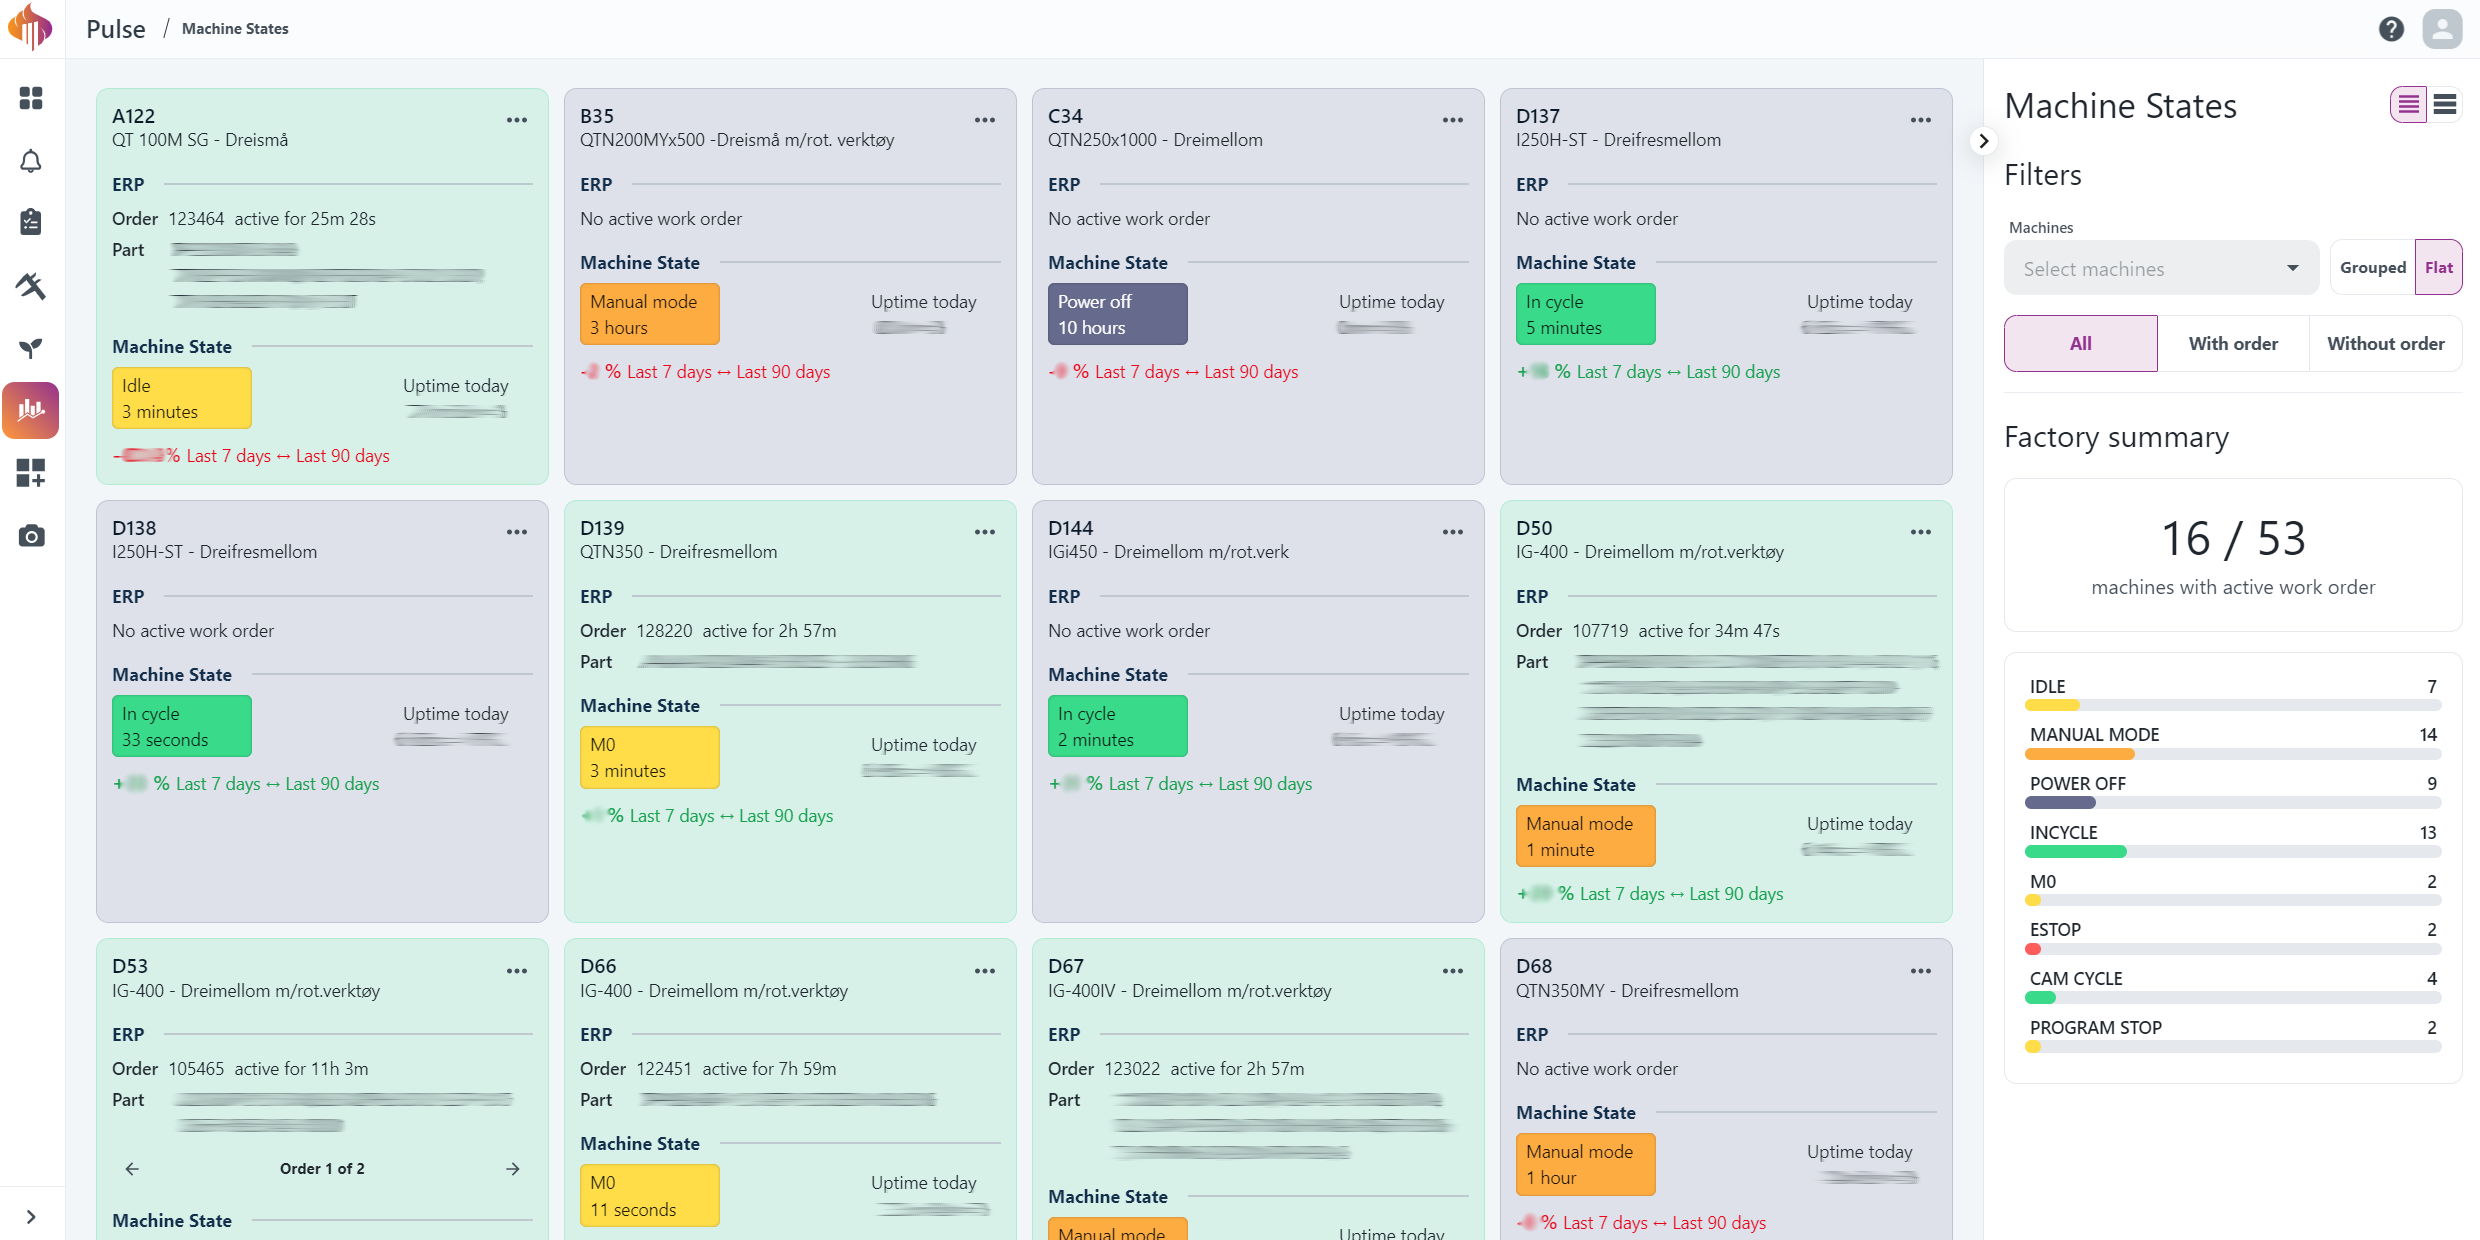
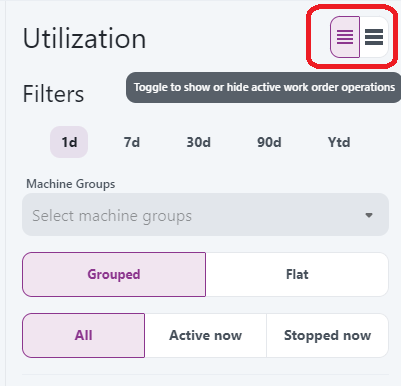
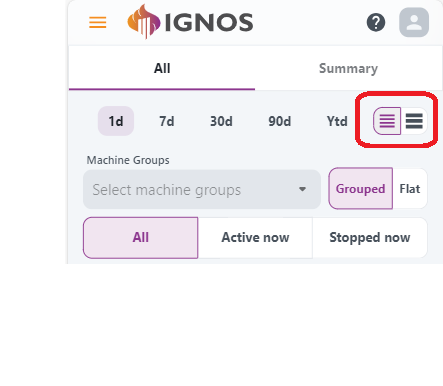
In the Machine States view, it is now possible to show more detailed information about the currently active work order in each machine. To switch between the two views, use the toggle at the top right hand corner:
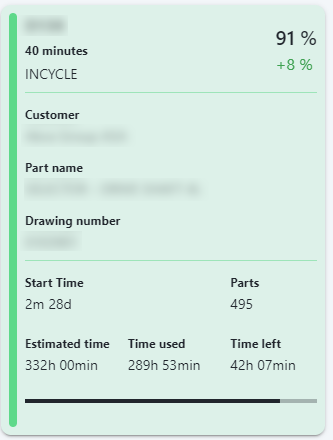
The detailed information contains
- Customer, part and drawing information
- Start time of the work order operation
- Number of parts to be produced
- Planned, used and remaining time
- Progress bar showing used time versus planned time
August 7, 2023
Single machine utilization view
The utilization view for a single machine has been changed from a dialog to a full screen page containing more information.
Machine state timeline page
The Pulse app now contains a page containing the current machine state and the machine state timeline for selected machines or groups of machines.
March 16, 2023
Bug fixes and improvements
We fixed a bug where the machine state timeline would behave incorrectly when selecting the preset 3 days option.
We also increased the maximum time range for the machine state timeline from 3 days to 7 days.
March 8, 2023
Machine States - Grouped view
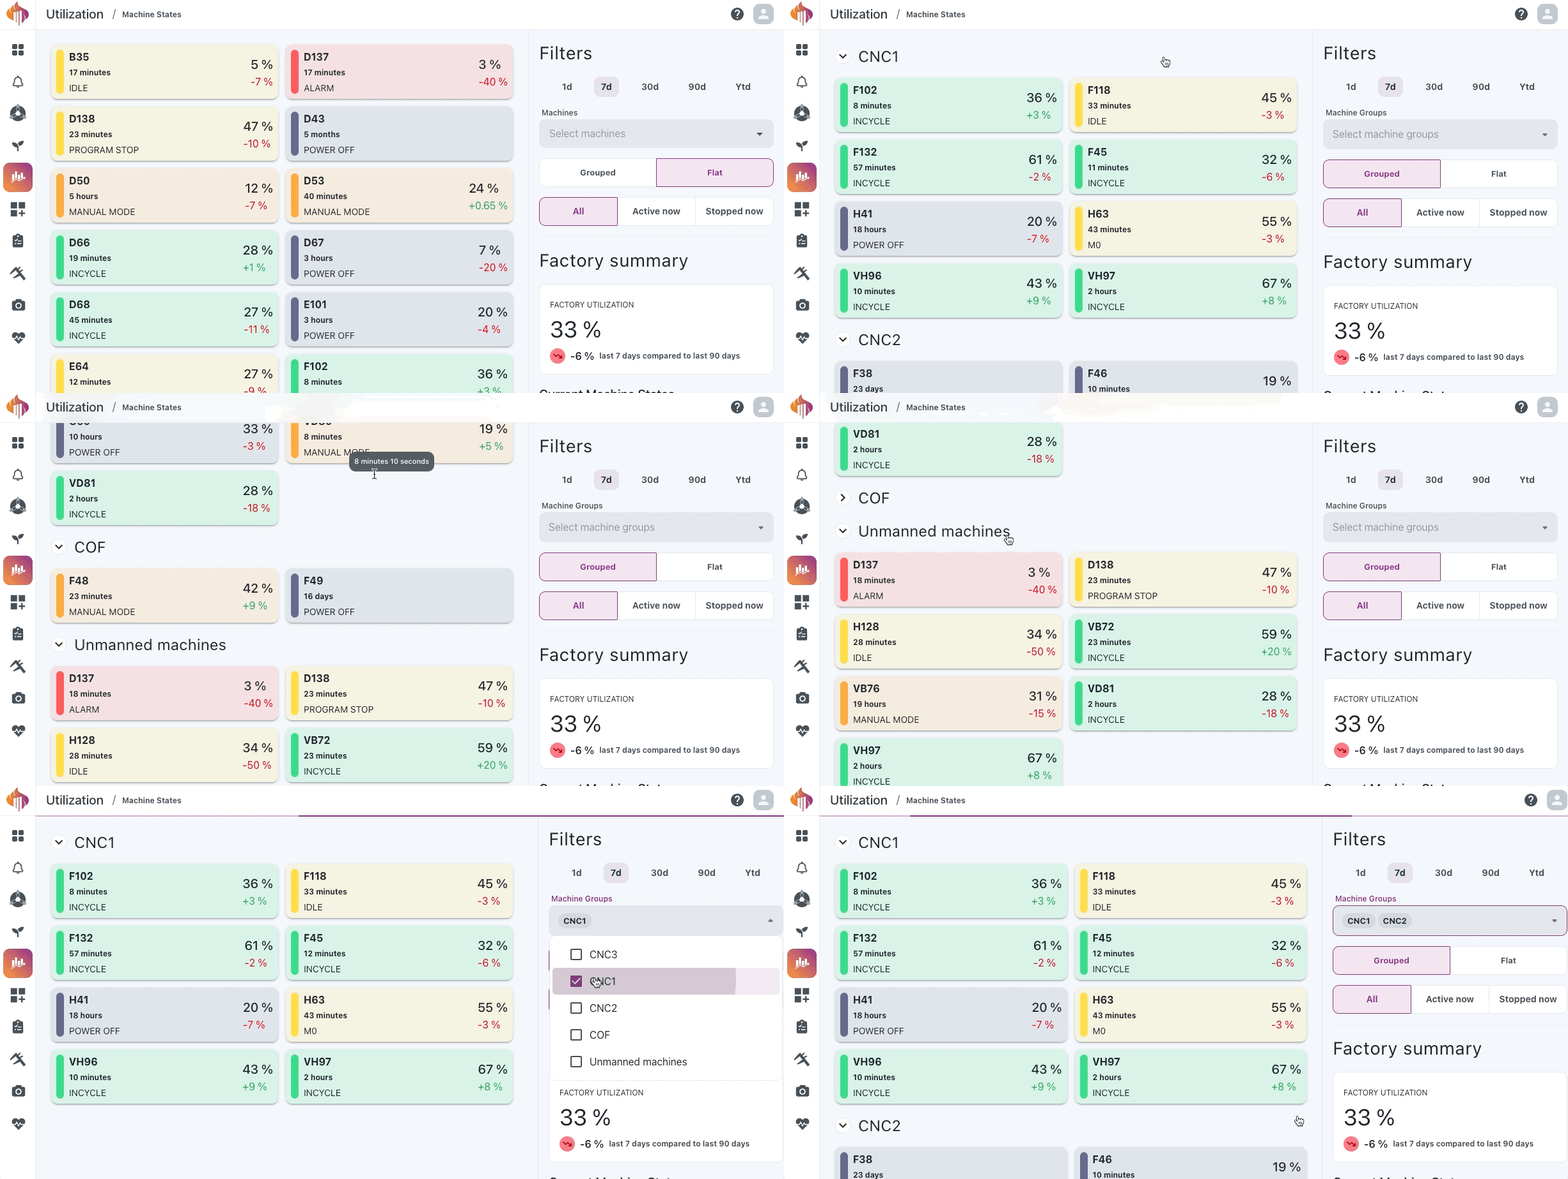
As mentioned in the previous release, we aim to gradually integrate machine groups in our apps. This update brings machine groups to the machine state overview. If you have any groups defined, you will be presented with a view mode toggle that lets you choose between grouped and flat mode. When grouped mode is active, you can choose to show only the group(s) you are interested in. If you don't select any specific groups, all groups will be visible, but you can still collapse and expand groups as you wish.
Selected view mode and selected groups will be persisted in the browser and automatically applied the next time you visit the page.
February 22, 2023
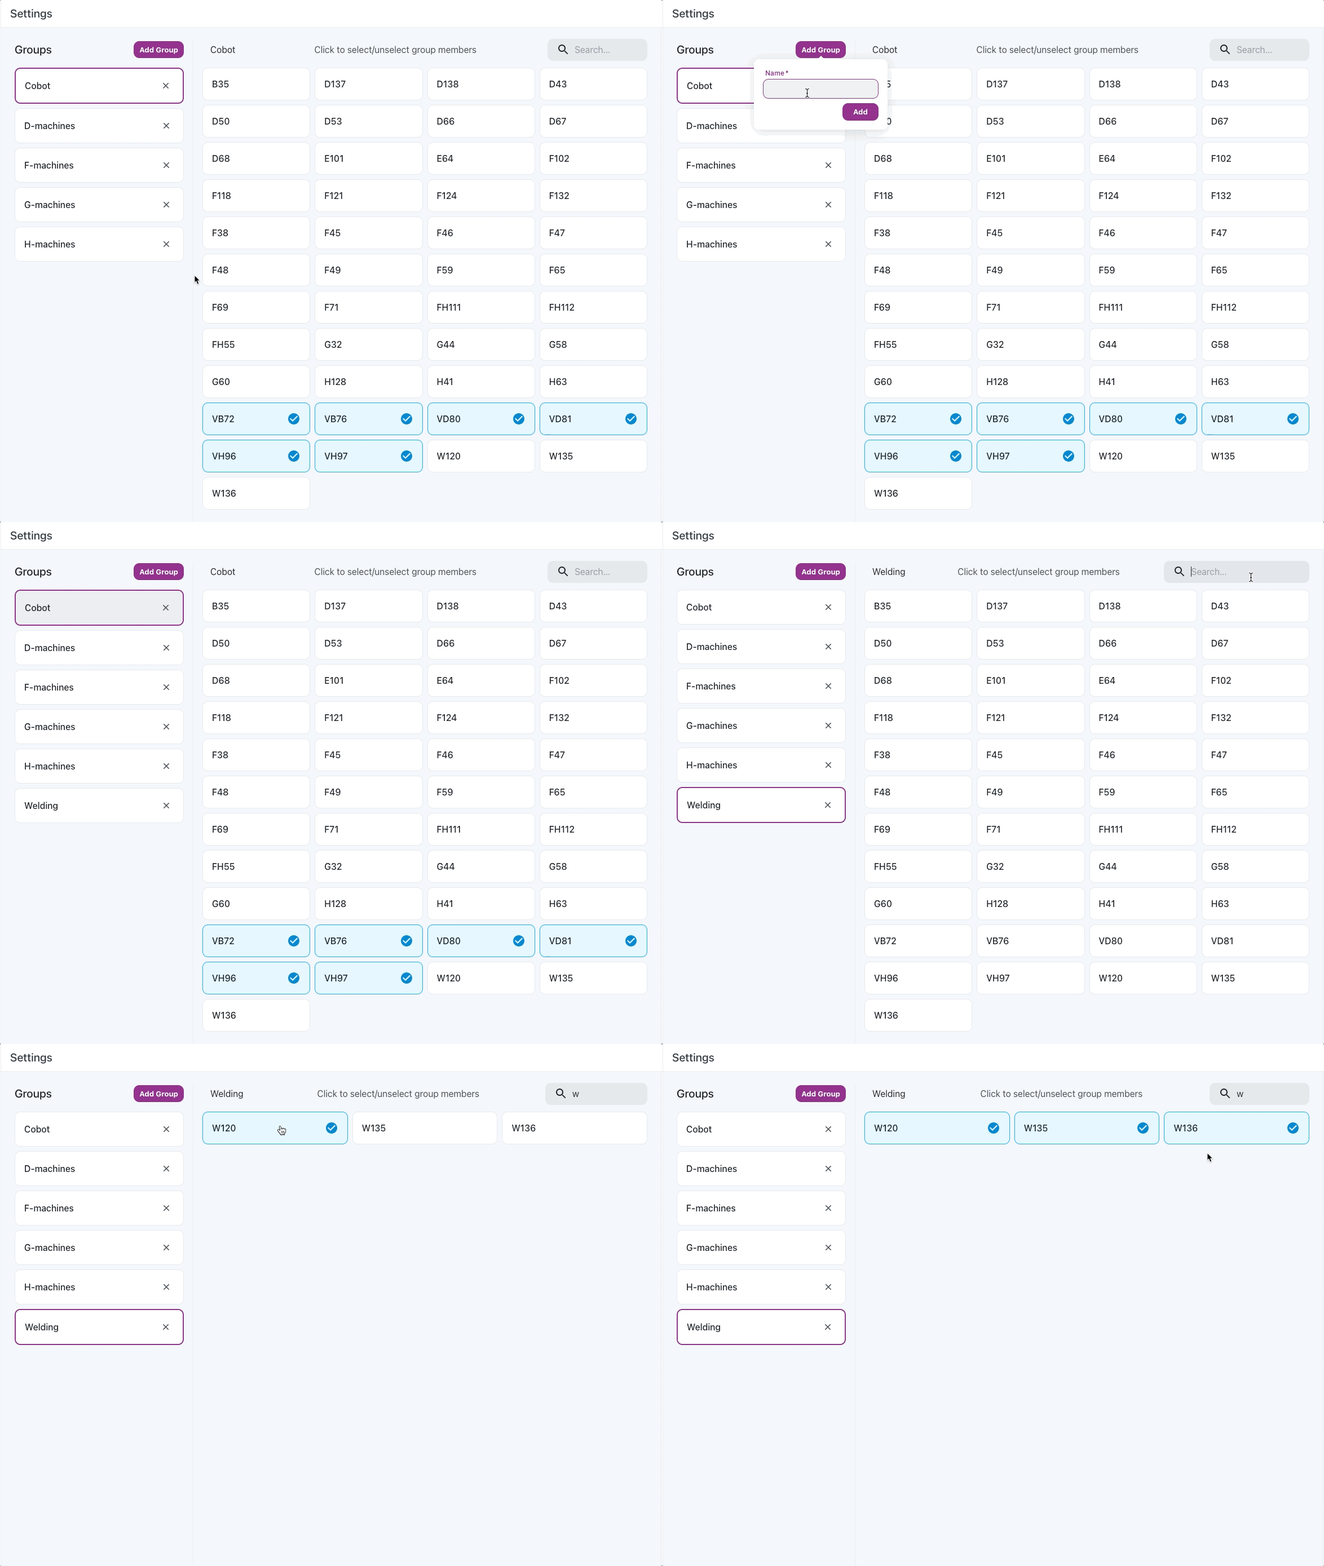
Machine groups
Based on feedback from users, we have added support for organizing machines into groups. This lets you group machines that are related to each other in one way or another. For instance, you might want to create a group for welding machines and one for robot aided CNC machines. It is totally up to you.
The groups are not personal and will be the same for all users.
In order to manage groups, you will need to have one of the following roles: Admin or Machines.Groups.Write.
Where are groups used?
Groups are currently only used in the Pulse app, but going forward we want to make use of groups across all apps.
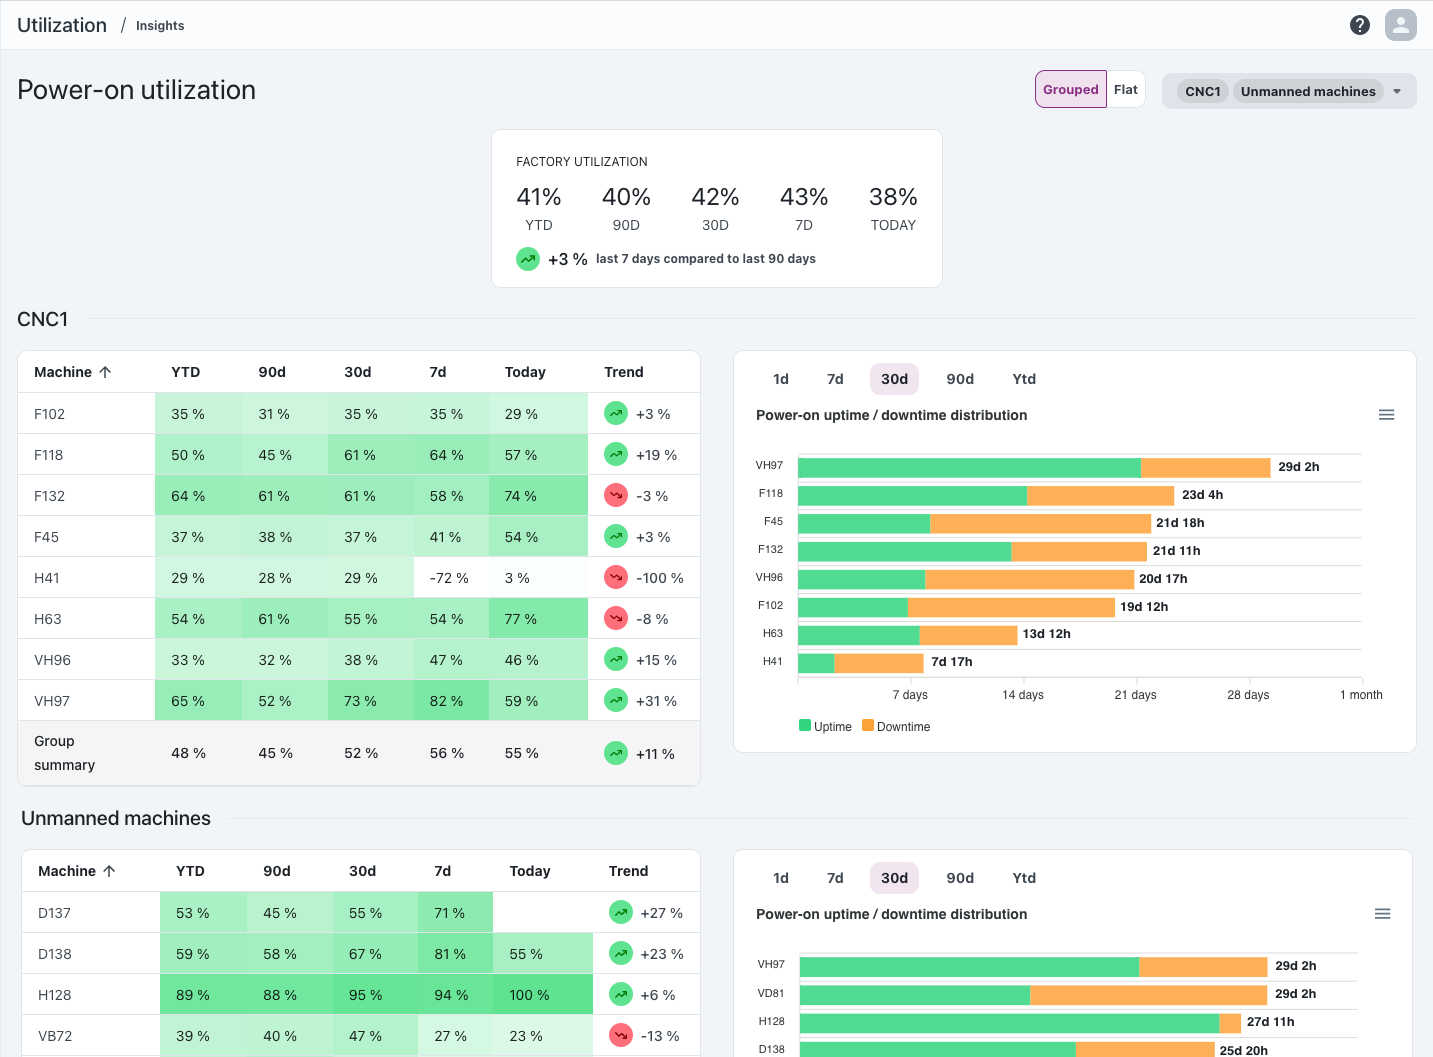
Utilization Insights
The current version of the Pulse app does not provide a clear picture of utilization over time accross multiple machines and groups. It is also a bit oscure because of the mix between live data and historical insights. We recognized a need to distinguish between live and historical data. This release introduces a new page for utilization insights, which aims to give you a clear overview of performance in terms of power-on utilization all the way from factory, groups and to individual machines over time.
The utilization table is by default sorted by machine name, but can be sorted by any other column if you want to. The power-on uptime/downtime chart is sorted by total power-on time in descending order. This is to give you an idea about which machines have the greatest impact on utilization as the percentage is weighted by how much the machine has been powered on.
We're looking forward to feedback from our users about this feature!
