Pulse Documentation - How to
This documentation is still being updated, so you might not find everything you're looking for just yet.
We apologize for any inconvenience this may cause.
If you have any questions or need further assistance, please don't hesitate to contact us or submit a ticket through our service desk.
We're here to help! 😊
Machine states
You will find everything regarding the Machine States module in this chapter.
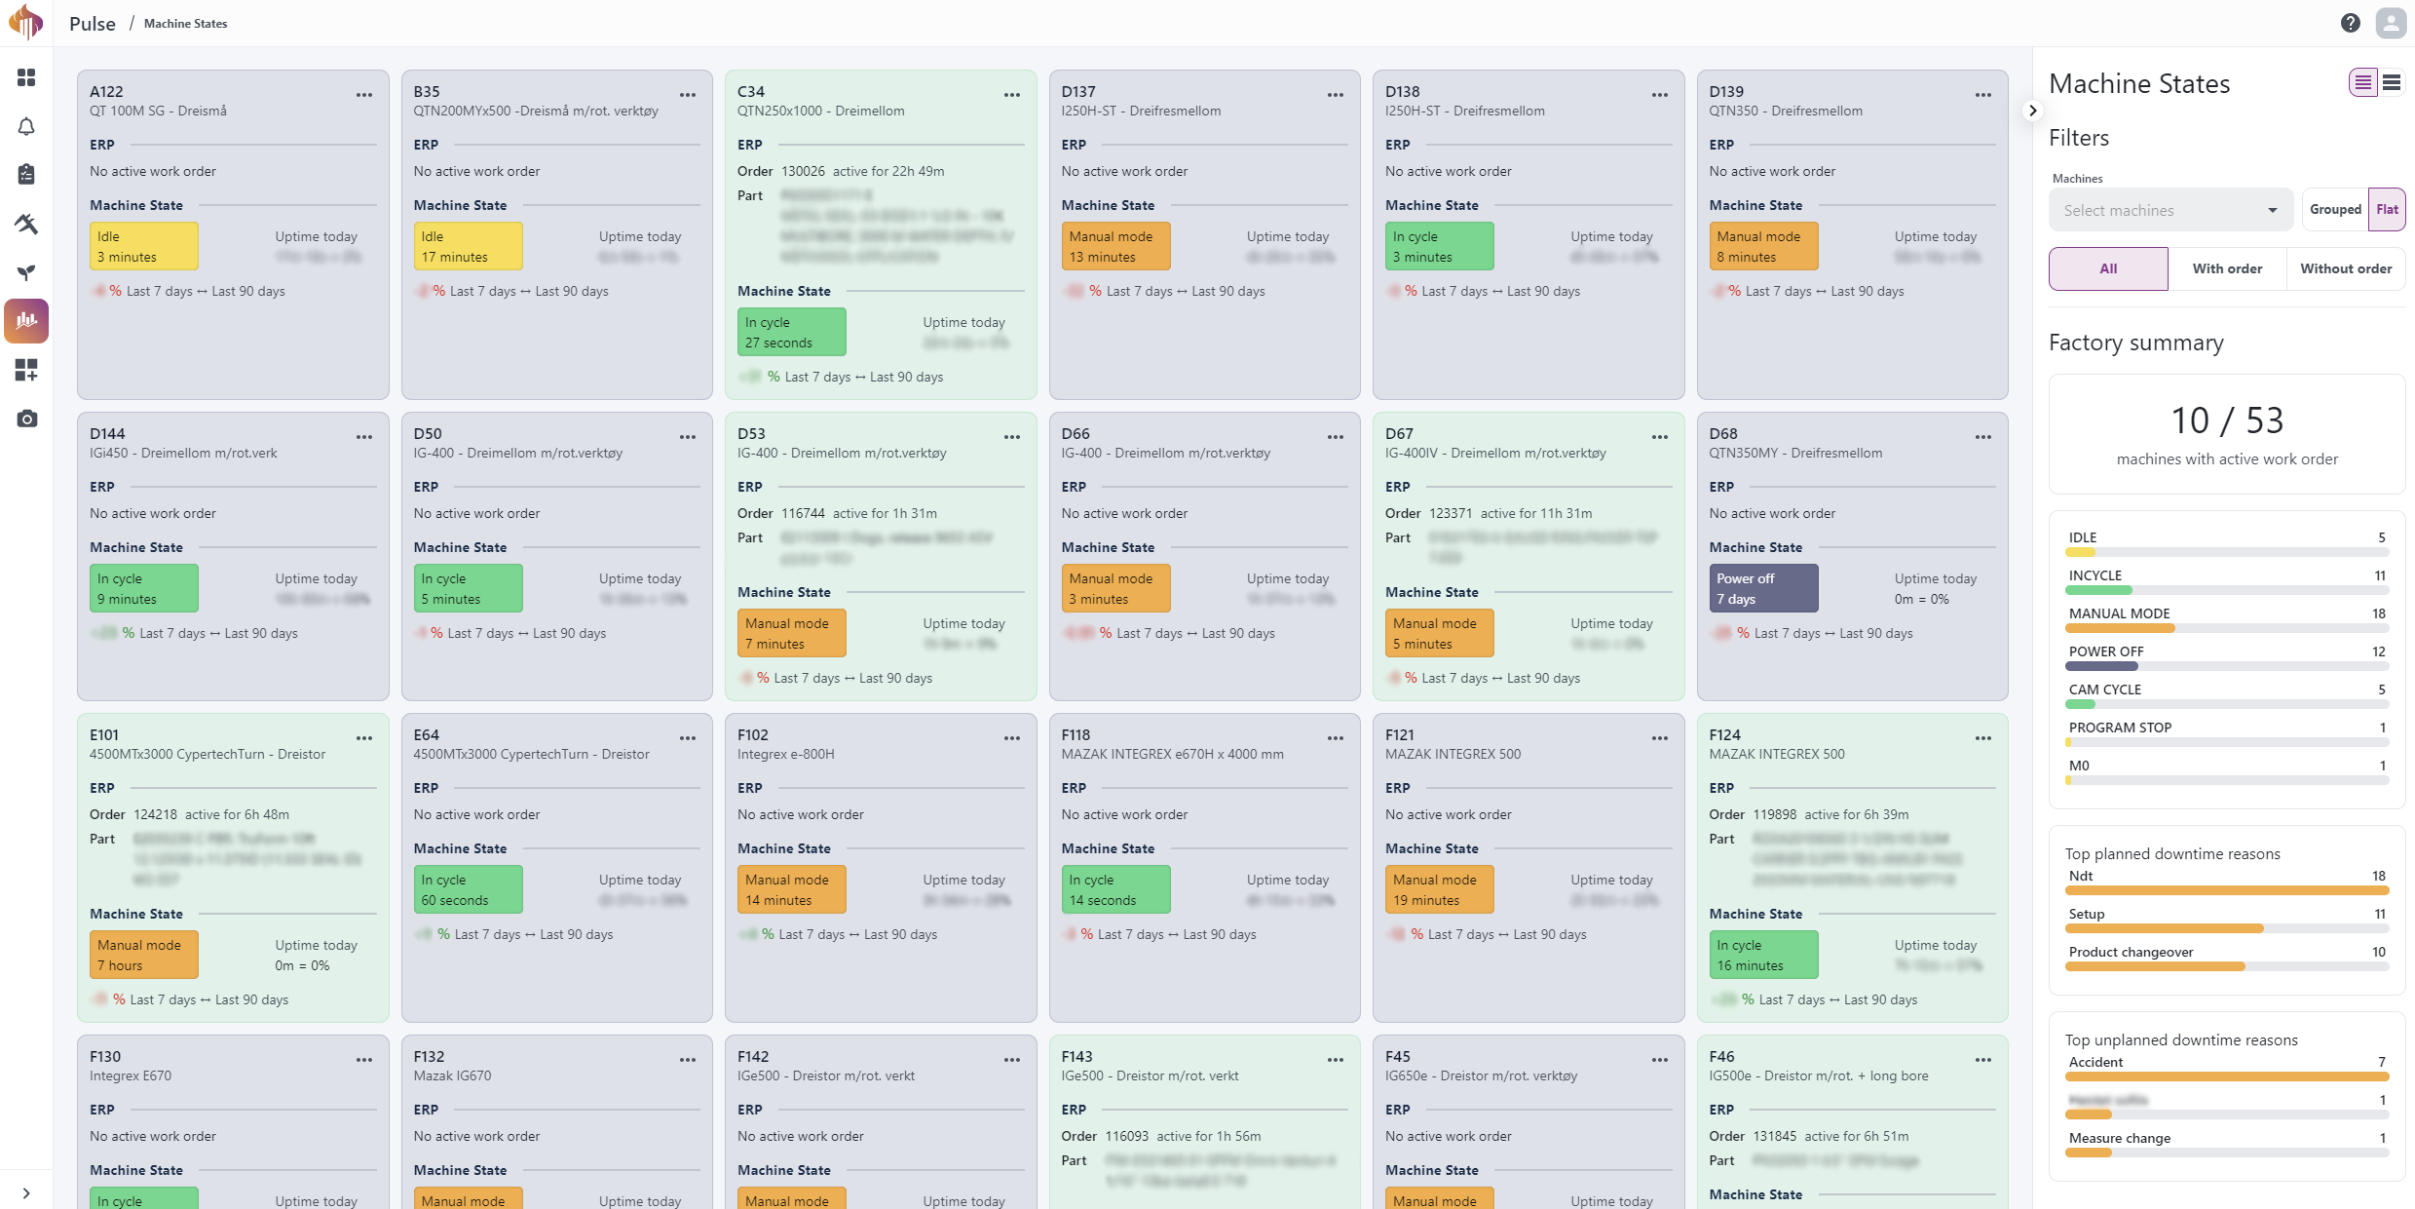
Machine States page
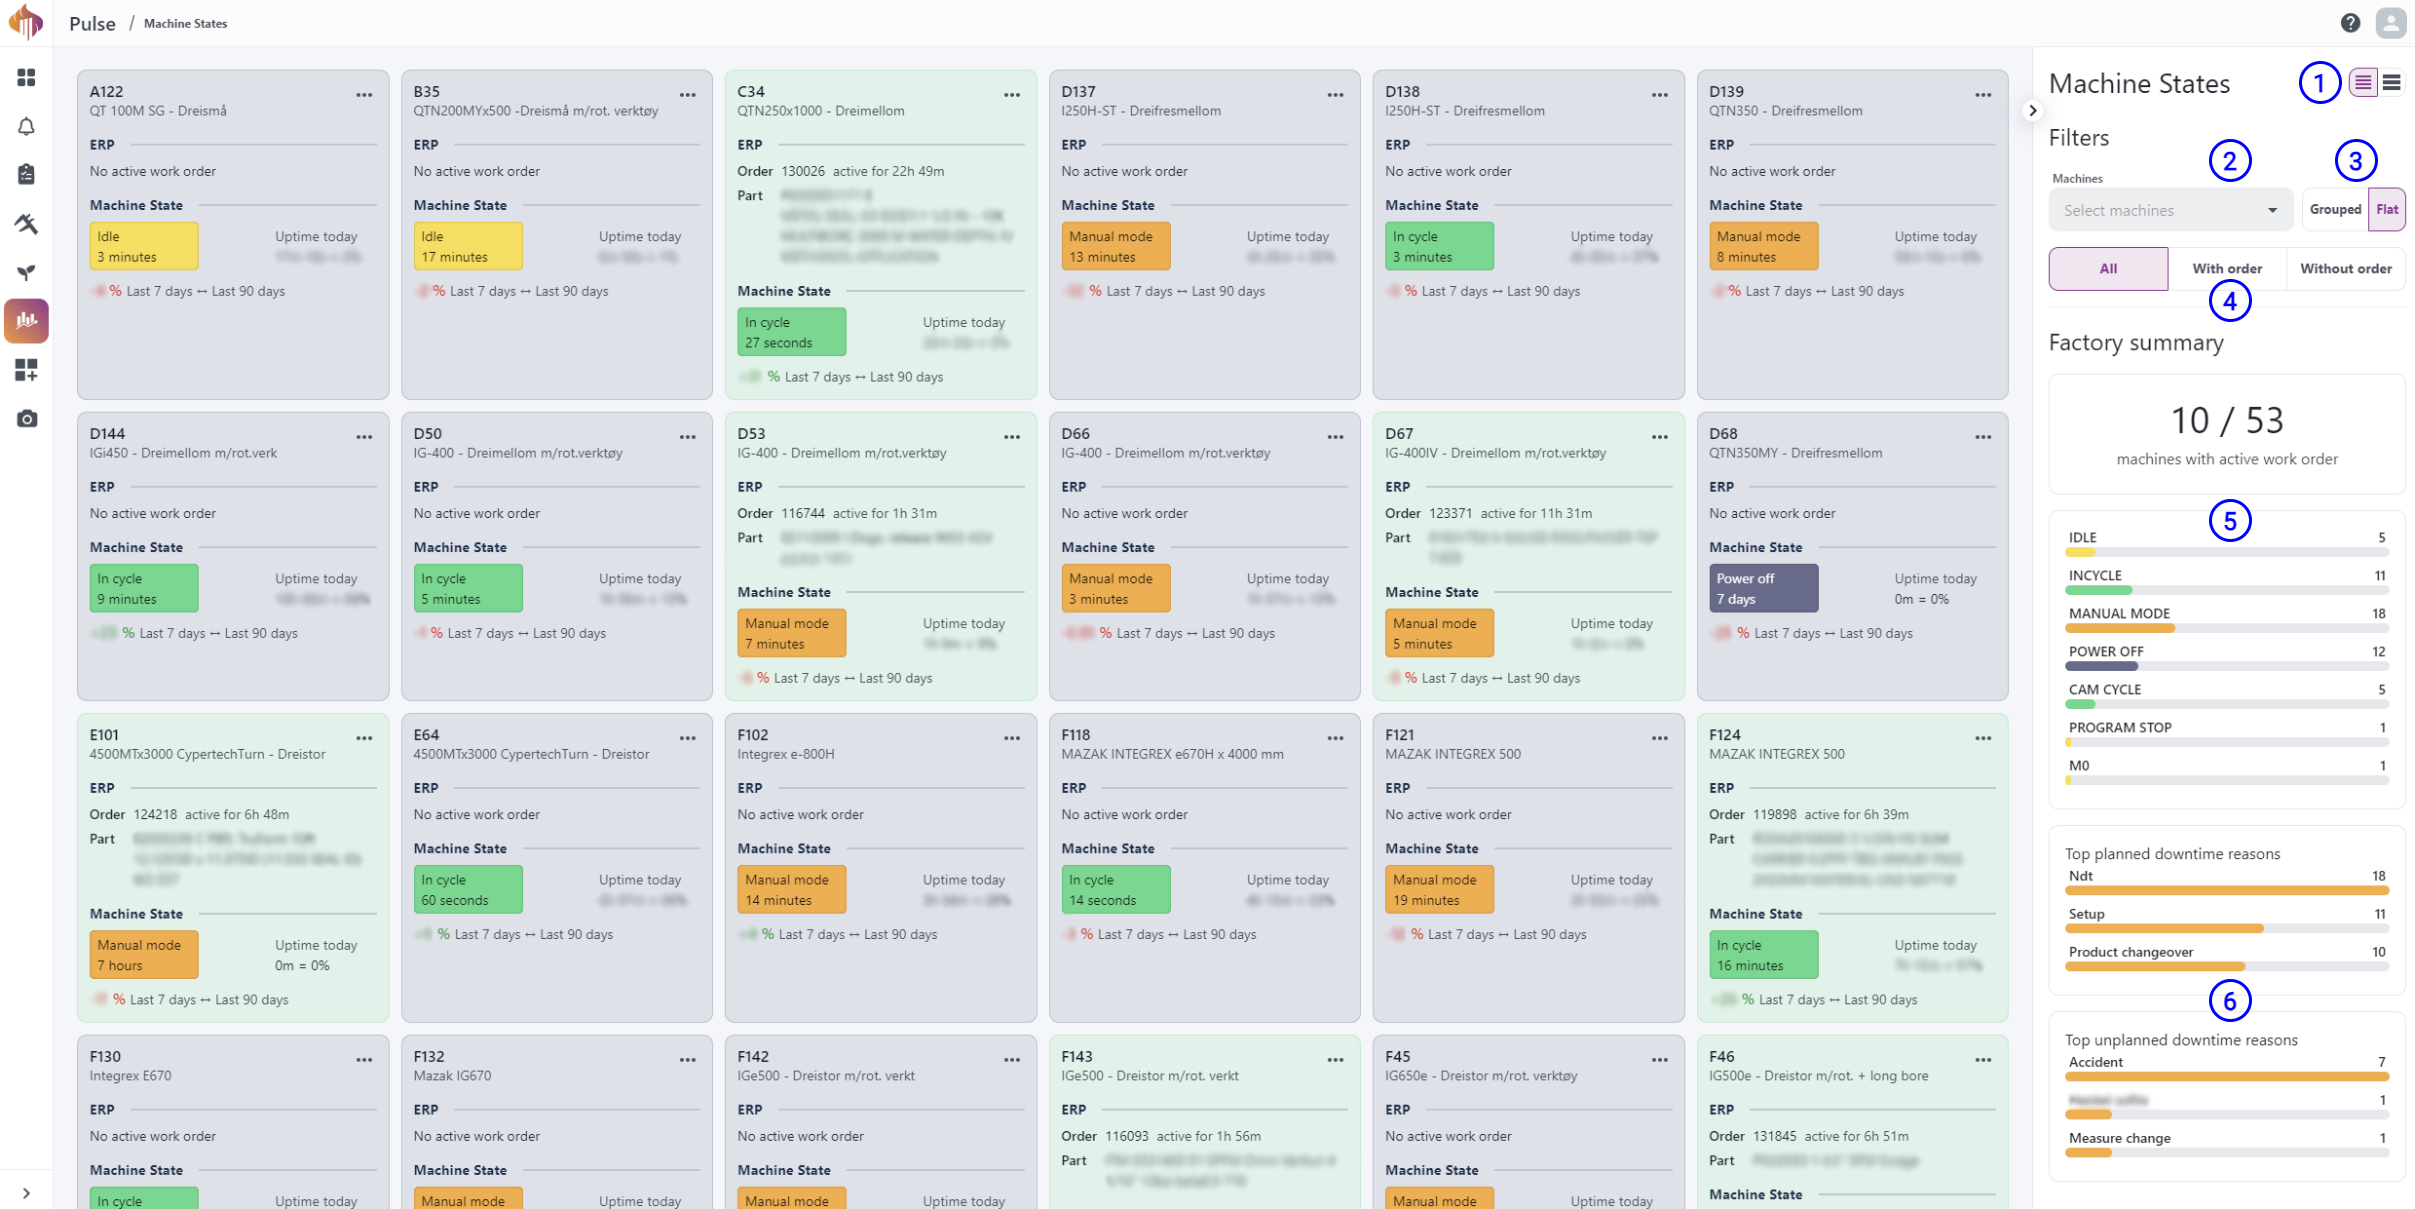
The first page you'll see is the Machine States page. Here you get an overview and a live image of the factory's resources. Each card represents a resource and shows details about ERP data, machine state, and active downtime reasons.
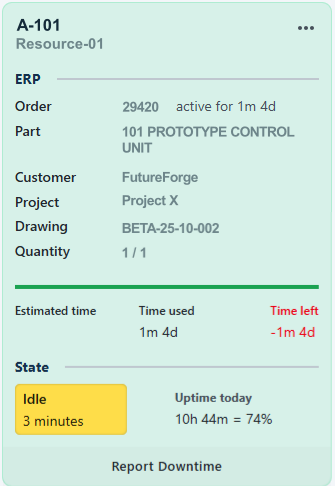
Resource card
This card shows the resource's current state, uptime, and relevant ERP data, including information on currently running work orders. It also contains controls for reporting downtime, including the reason and resolution. Resources with active work orders will appear green.
Sidebar descriptions:The page has a sidebar with filter options and factory summary.
-
Show/hide: Show/hide ERP order details.
-
Machines/Machine Groups: Select specific resources or groups you'd like to display.
-
Grouped/Flat: Select if you'd like to display resources based on groups or not.
-
All/With order/Without order: Display resources according to the selected filter.
-
Machine states overview: Widget displaying the count of all current states registered in the shop.
-
Downtime overview: Two widgets displaying the top planned/unplanned downtime reasons.
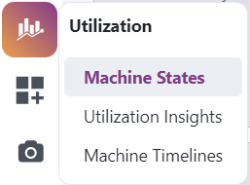
Resource insights
Pulse now opens Resource insights in Workspace instead of the older standalone Machine Insights page.
In Pulse, this resource-specific flow is currently available through Current States. Open the triple-dot menu on a resource card and press Resource insights. The selected resource is then opened in the Default resource workspace.
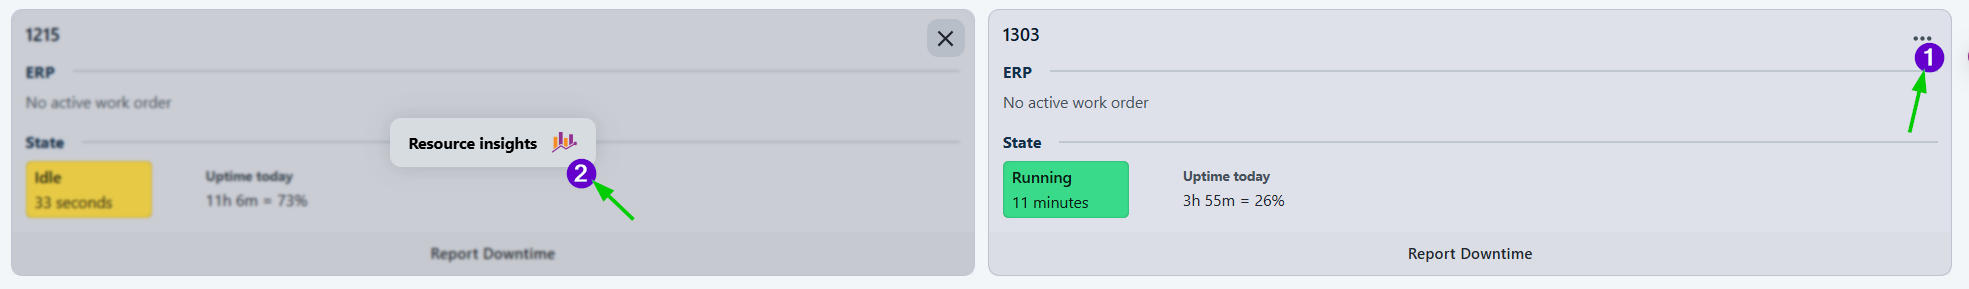
When a user clicks Resource insights, Ignos does the following:
-
Identifies which resource was clicked.
-
Looks up that resource in Settings -> Pulse -> Default workspaces.
-
Opens the assigned workspace template in Workspace and applies the selected resource as widget context.
-
Shows an informative message if no default workspace template has been assigned to that resource.

Default resource workspace
The Default resource workspace is a resource-context-driven workspace tab. Widgets in this workspace use the currently selected resource, so the same workspace layout can be reused across many resources.
When you open Resource insights from Pulse, Ignos automatically loads the default workspace for that resource. If you switch to another resource, the displayed workspace updates to match the selected resource.
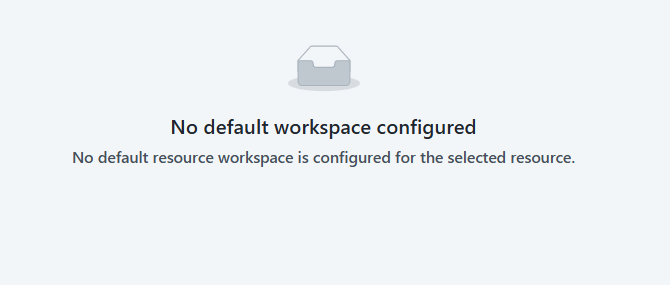
If no default workspace has been configured for the selected resource, Ignos shows an informative message instead of opening an empty page.
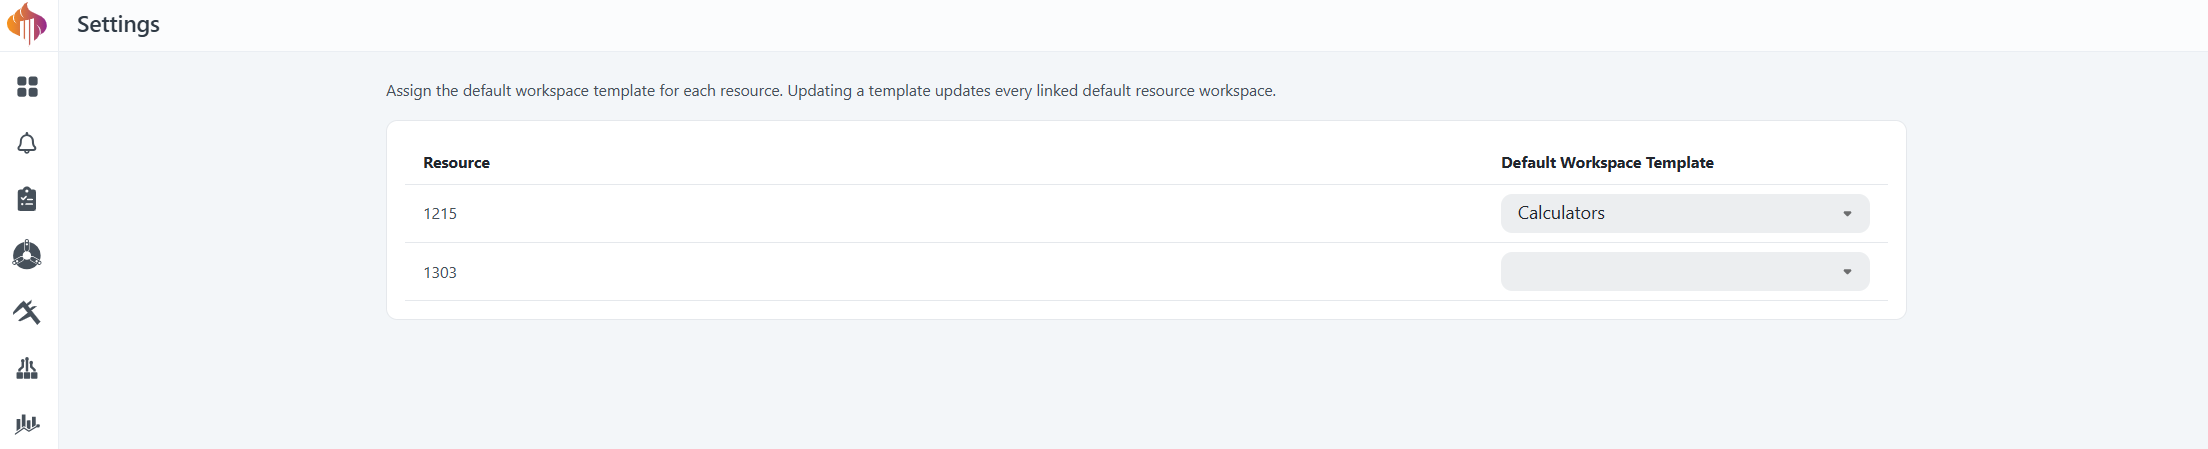
Admin setup for default workspaces
Admins can configure which template should be used as the default workspace for each resource in Settings -> Pulse -> Default workspaces.
Each resource can be assigned its own workspace template. When a template is updated, all linked default resource workspaces are updated as well.
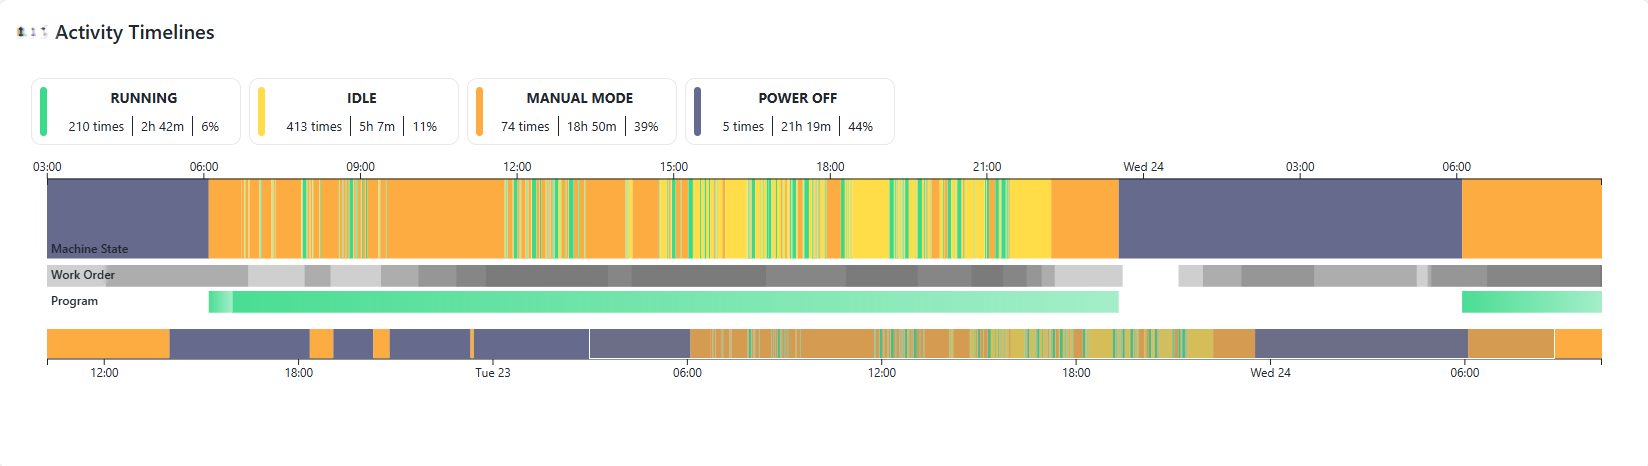
Resource Activity Timeline
The Resource Activity Timeline gives you a visual insight on machine states, workorder and programs for a resource between a timer range. It can be found in Machine Insights or as widget in Workspace.
Notice how you're also able to report a downtime reason through this widget.
The GIF below demonstrates it.
Machine Timelines page
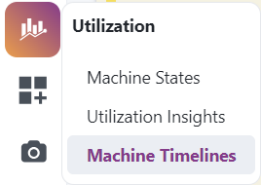
The Machine Timelines page offers a comprehensive overview of the factory's resource machine state timelines.
You can view timelines by individual assets or grouped resources and gain detailed insights into their states, either live, or over a selected time period.
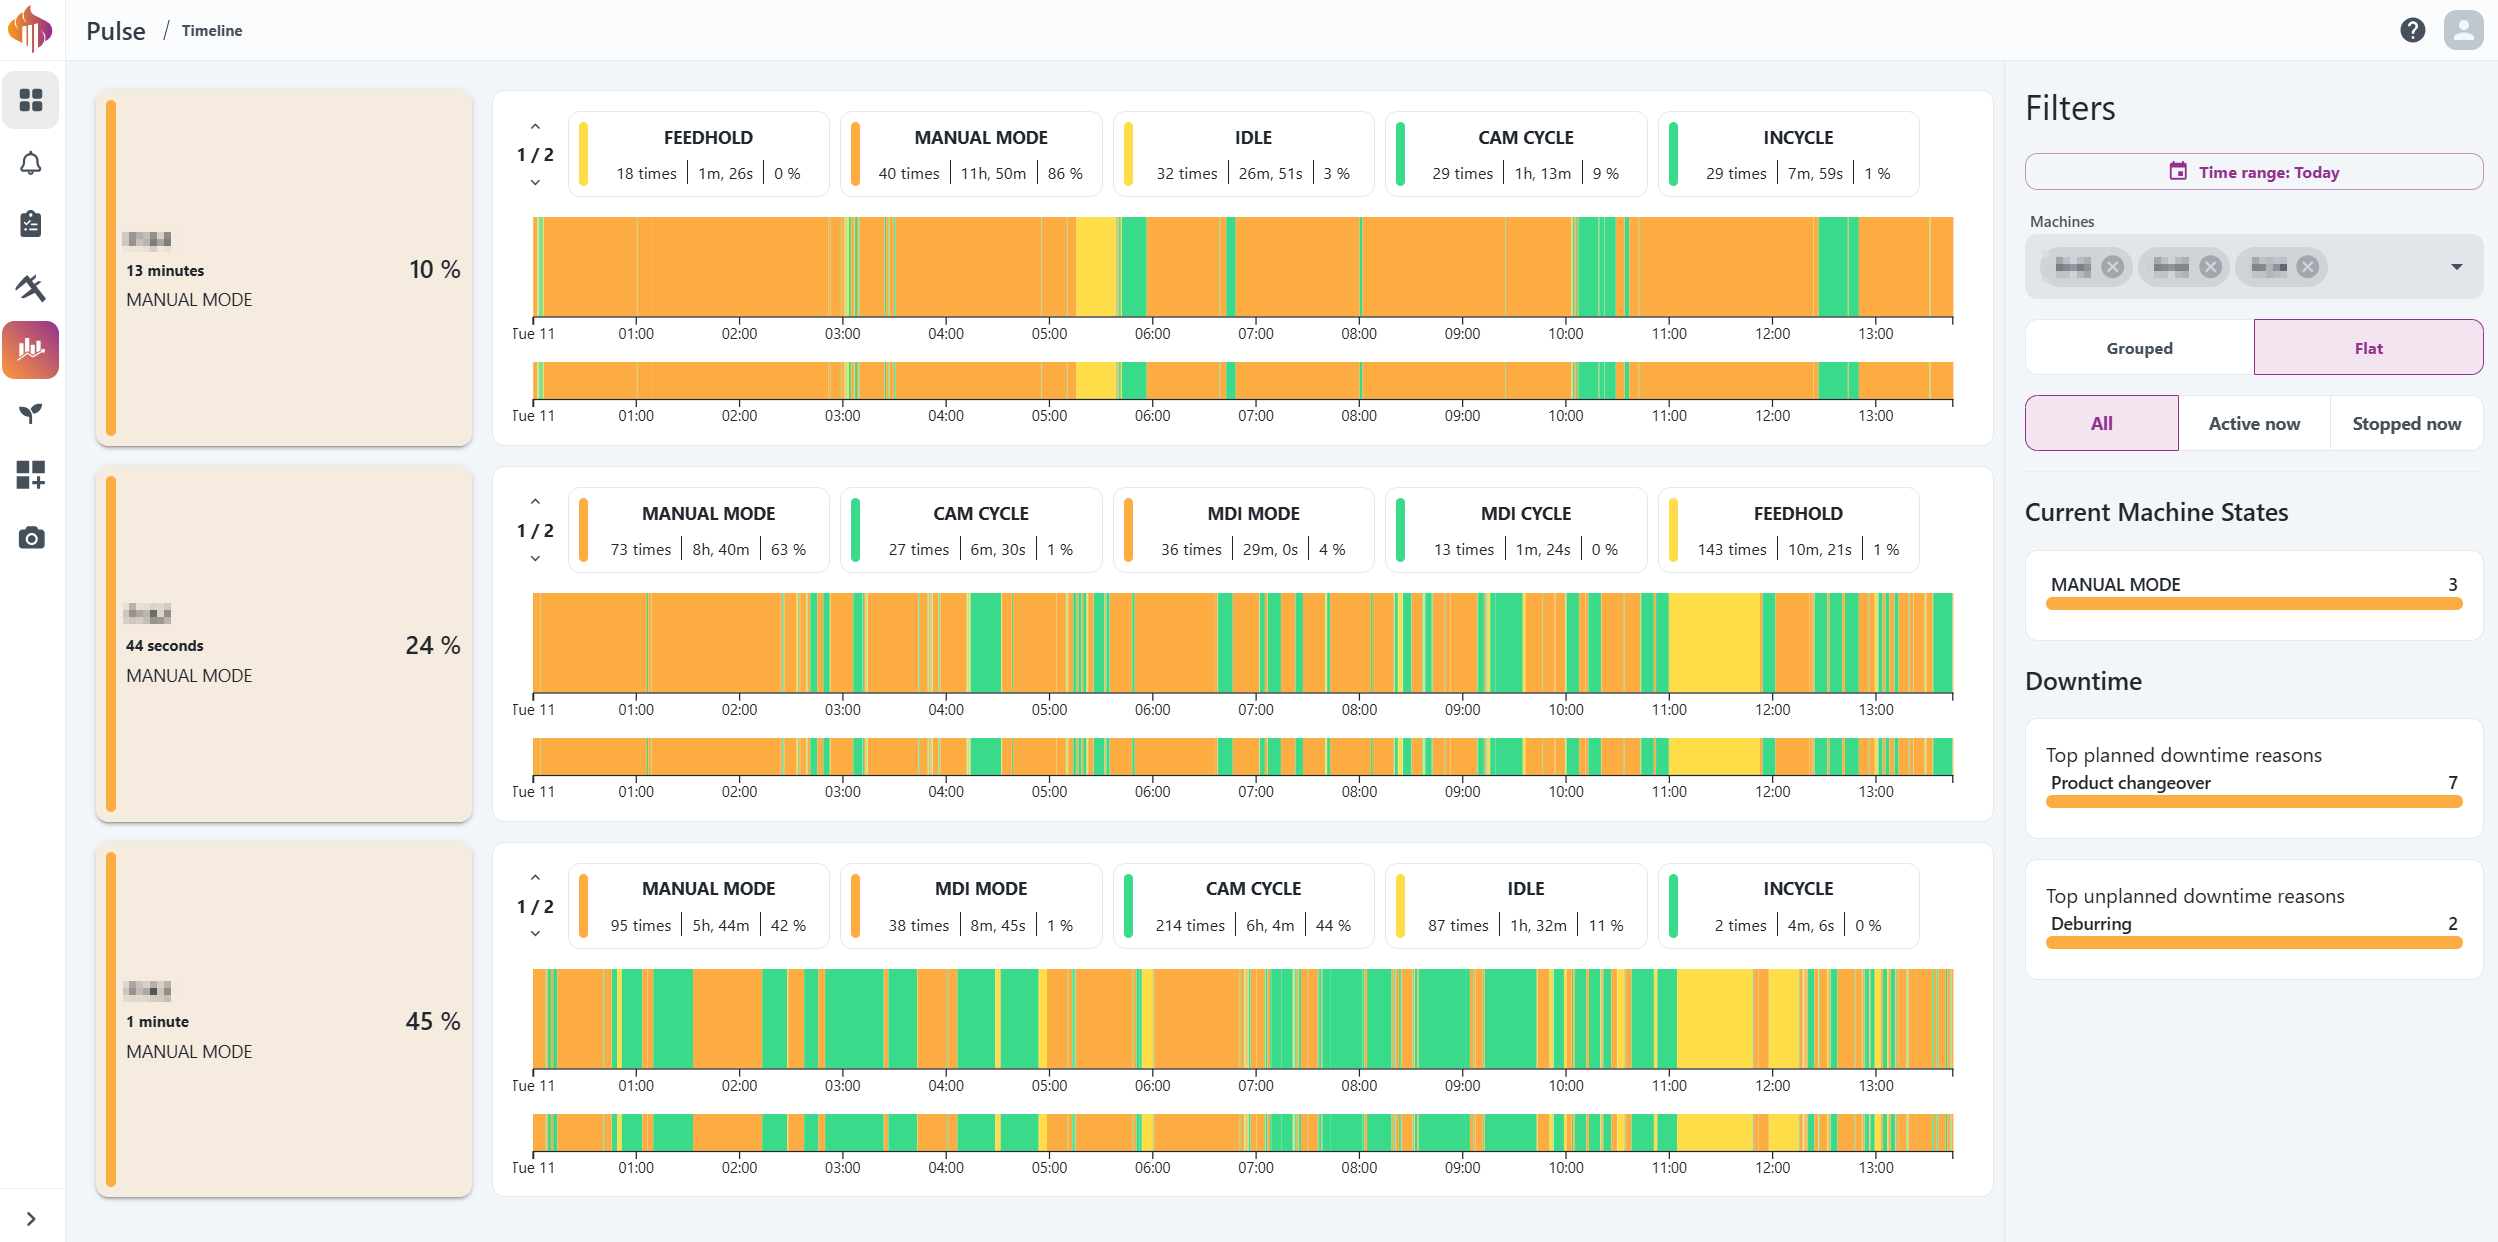
Descriptions:
-
Time range: Filter to show the data for the selected timespan.
-
Machines box: Search, and select individual machines or groups to be displayed.
-
Grouped/Flat: Select if you'd like to display resources based on groups or not.
-
All/Active now/Stopped now: Display the filtered machines based on machine state.
-
Current machine states: Shows all the live machine states found in the list of timelines.
-
Downtime: Shows the top planned and unplanned downtime reasons found in the time range defined on point 1.
Utilization Insights
You will find everything regarding the Utilization Insights module in this chapter.
Utilization Insights page
The Utilization Insights page offers an overview over the factory's utilization numbers.
Here you'll be able to see how the factory performs as a whole, by group or by asset and identify trends over time.
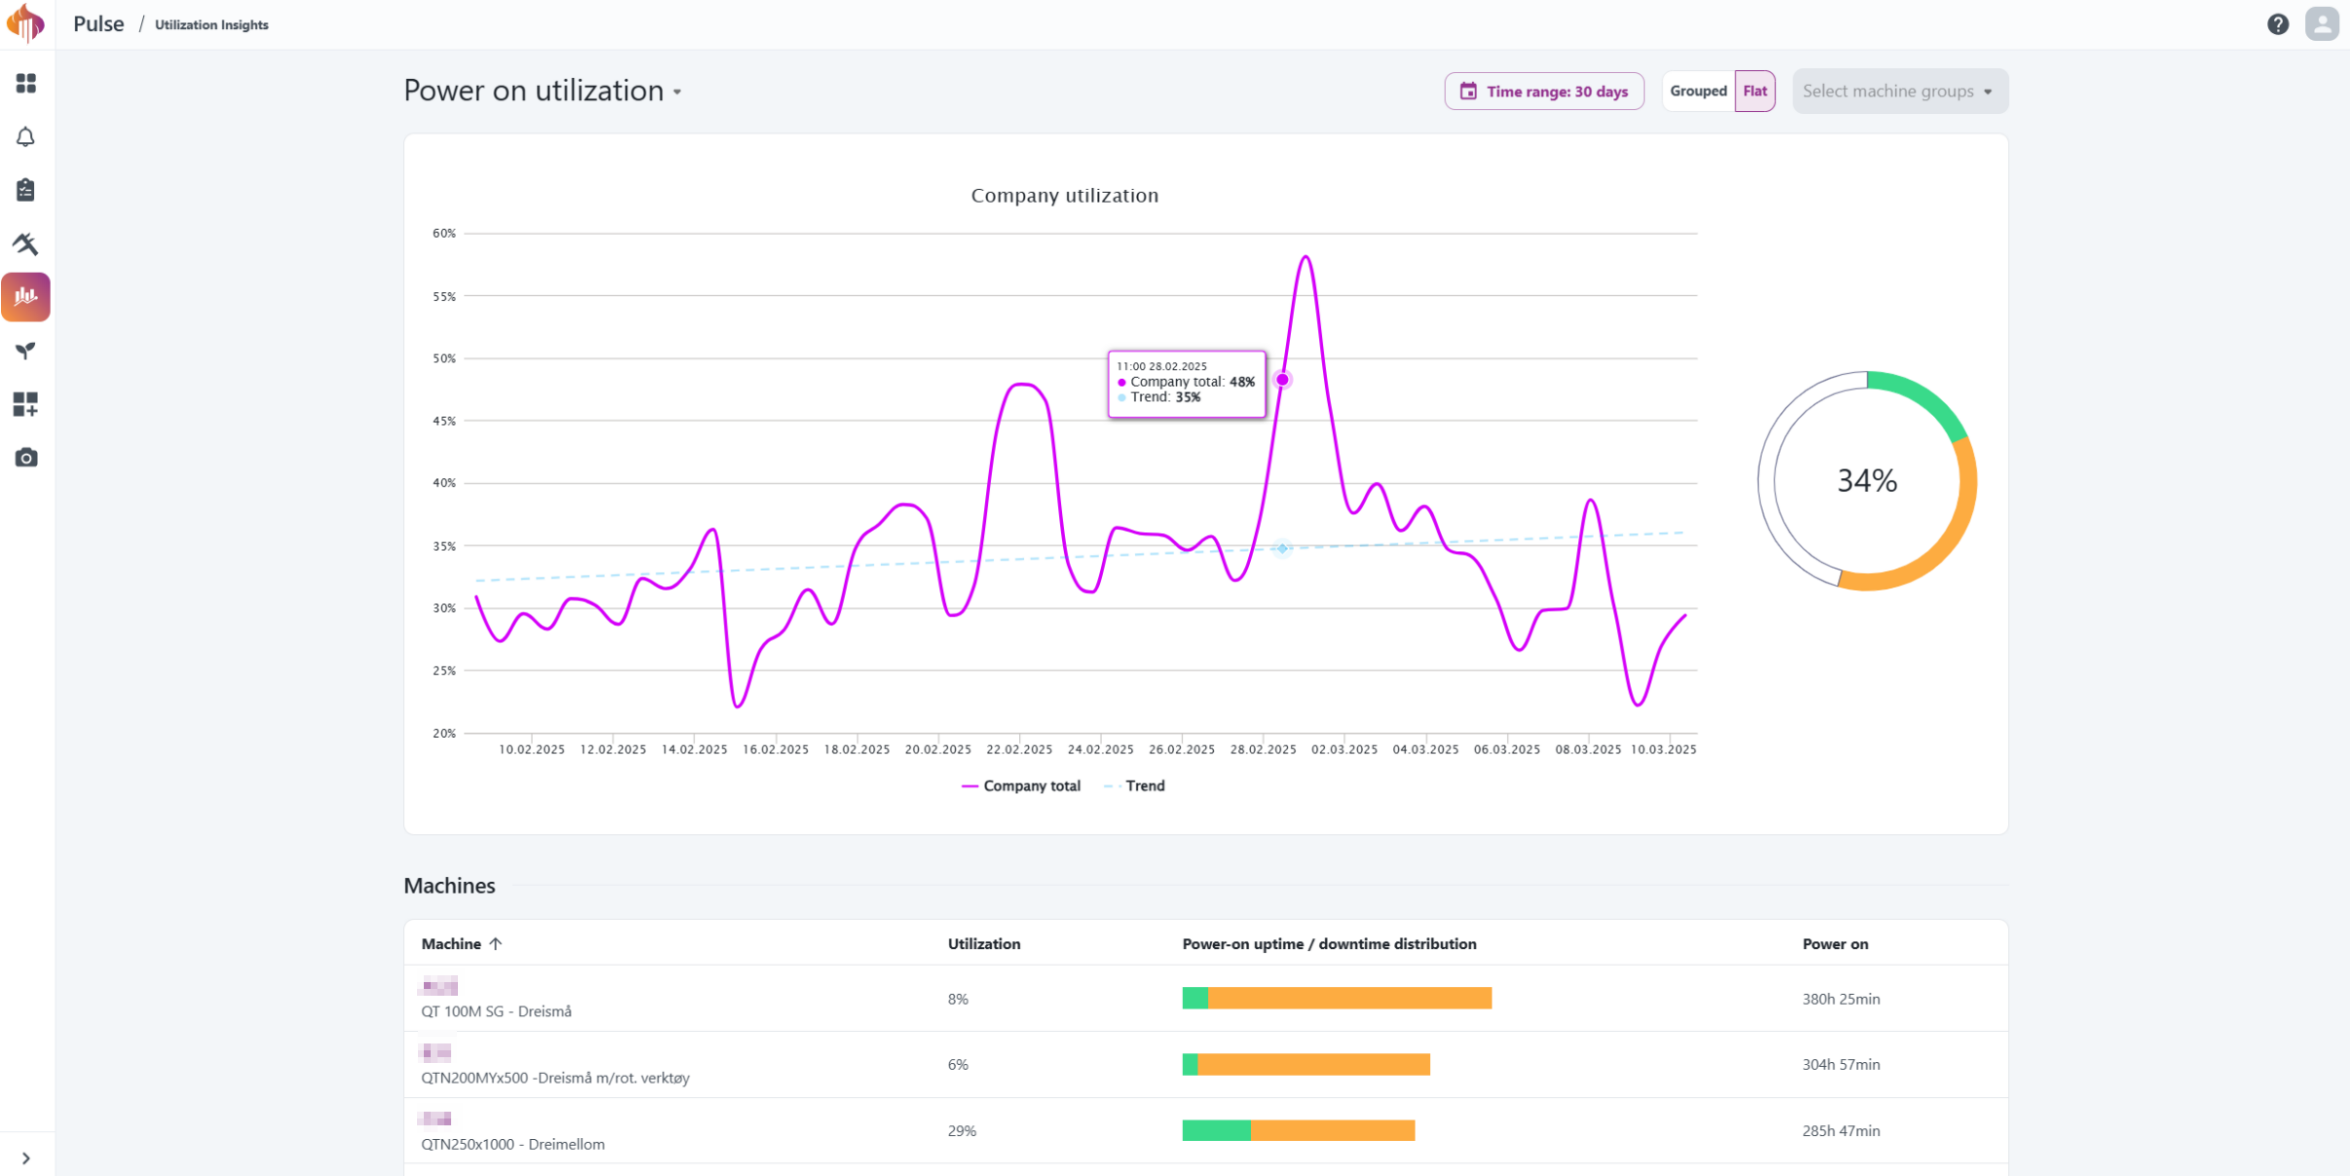
Descriptions:
Utilization calculation methods
We currently provide four methods for displaying utilization data, with a fifth option under development and coming soon.
Below, these methods are explained in detail.
Power-on utilization
This metric reflects how efficiently the machine is used while operational, and does not account for periods when the machine was turned off or its overall capacity.
Example:
"Sample CNC Machine" has been operational for 8 hours a day between January and May. During this period, the Power-on utilization numbers are very good.
Here’s a figure illustrating the Power-on utilization:
However, when the same data is analyzed in a 24/7 context, the utilization numbers change significantly:
The following section provides more details about 24/7 utilization.
24/7 utilization
This metric considers the entire day, including periods when the machine was powered off, providing a broader view of its overall usage. For example, as shown in the figure above, the 24/7 utilization numbers for Sample CNC Machine are lower, because the machine was only operational for 8 out of 24 hours each day.
Active-order utilization
This method is currently under development and will be available soon.
This metric focuses on the alignment between machine usage and active job assignments, providing a detailed view of operational efficiency linked to ERP-driven workflows. Unlike power-on utilization, which includes all powered-on time, active-order utilization specifically excludes periods when no one was clocked into an order, even if the machine was running or ready to operate.
Machine Capacity utilization (OEE)
OEE (Overall Equipment Effectiveness) represents how effectively a machine produces during the time it was scheduled to run, according to the Machine calendars.
Formula
- Availability = Uptime ÷ Planned Production Time
- Performance = (Ideal Cycle Time × Total Pieces) ÷ Operating Time F
- Quality = Good Pieces ÷ Total Pieces
Example calculation
⚠️ Note: In systems where Performance and Quality values are available, the OEE calculation will include them. When these values are not provided, they are automatically set to 100%, meaning OEE effectively reflects Availability.
ℹ️ Availability here is based on the machine’s Capacity settings.
💡 Important for admins:
Very low capacity values (e.g., 0.1 h) can cause extremely high utilization spikes in Machine Capacity charts if production occurs on those days.
To avoid distorted results, set non-production days (like weekends) to 0 h instead of small fractional values.
This metric shows how well a machine's production met the planned capacity time, filtering out time you intentionally didn’t plan to run.
Factory Calendar utilization (OOE)
OOE (Overall Operations Effectiveness) measures effectiveness against the entire scheduled calendar window (Factory calendar). It answers the question: “Out of all the time that was scheduled in the calendar, how much effective production did we achieve?”
Formula
- Availability = Uptime ÷ Calendar Time
- Performance = (Ideal Cycle Time × Total Pieces) ÷ Operating Time
- Quality = Good Pieces ÷ Total Pieces
Example calculation
⚠️ Note: In systems where Performance and Quality values are available, the OEE calculation will include them. When these values are not provided, they are automatically set to 100%, meaning OEE effectively reflects Availability.
ℹ️ Availability here is based on the Factory Calendar settings.
This metric shows how well production utilized the entire factory calendar time, including periods you intentionally planned as downtime. As a result, OOE values are typically lower than OEE in environments with many scheduled stops.
Comparison of utilization methods
The figure below highlights how the three utilization methods - Power-on utilization, 24/7 utilization, and Active-order utilization, differ in focus and scope. Each provides unique insights into machine efficiency, from operational hours to full capacity usage and task-specific performance.
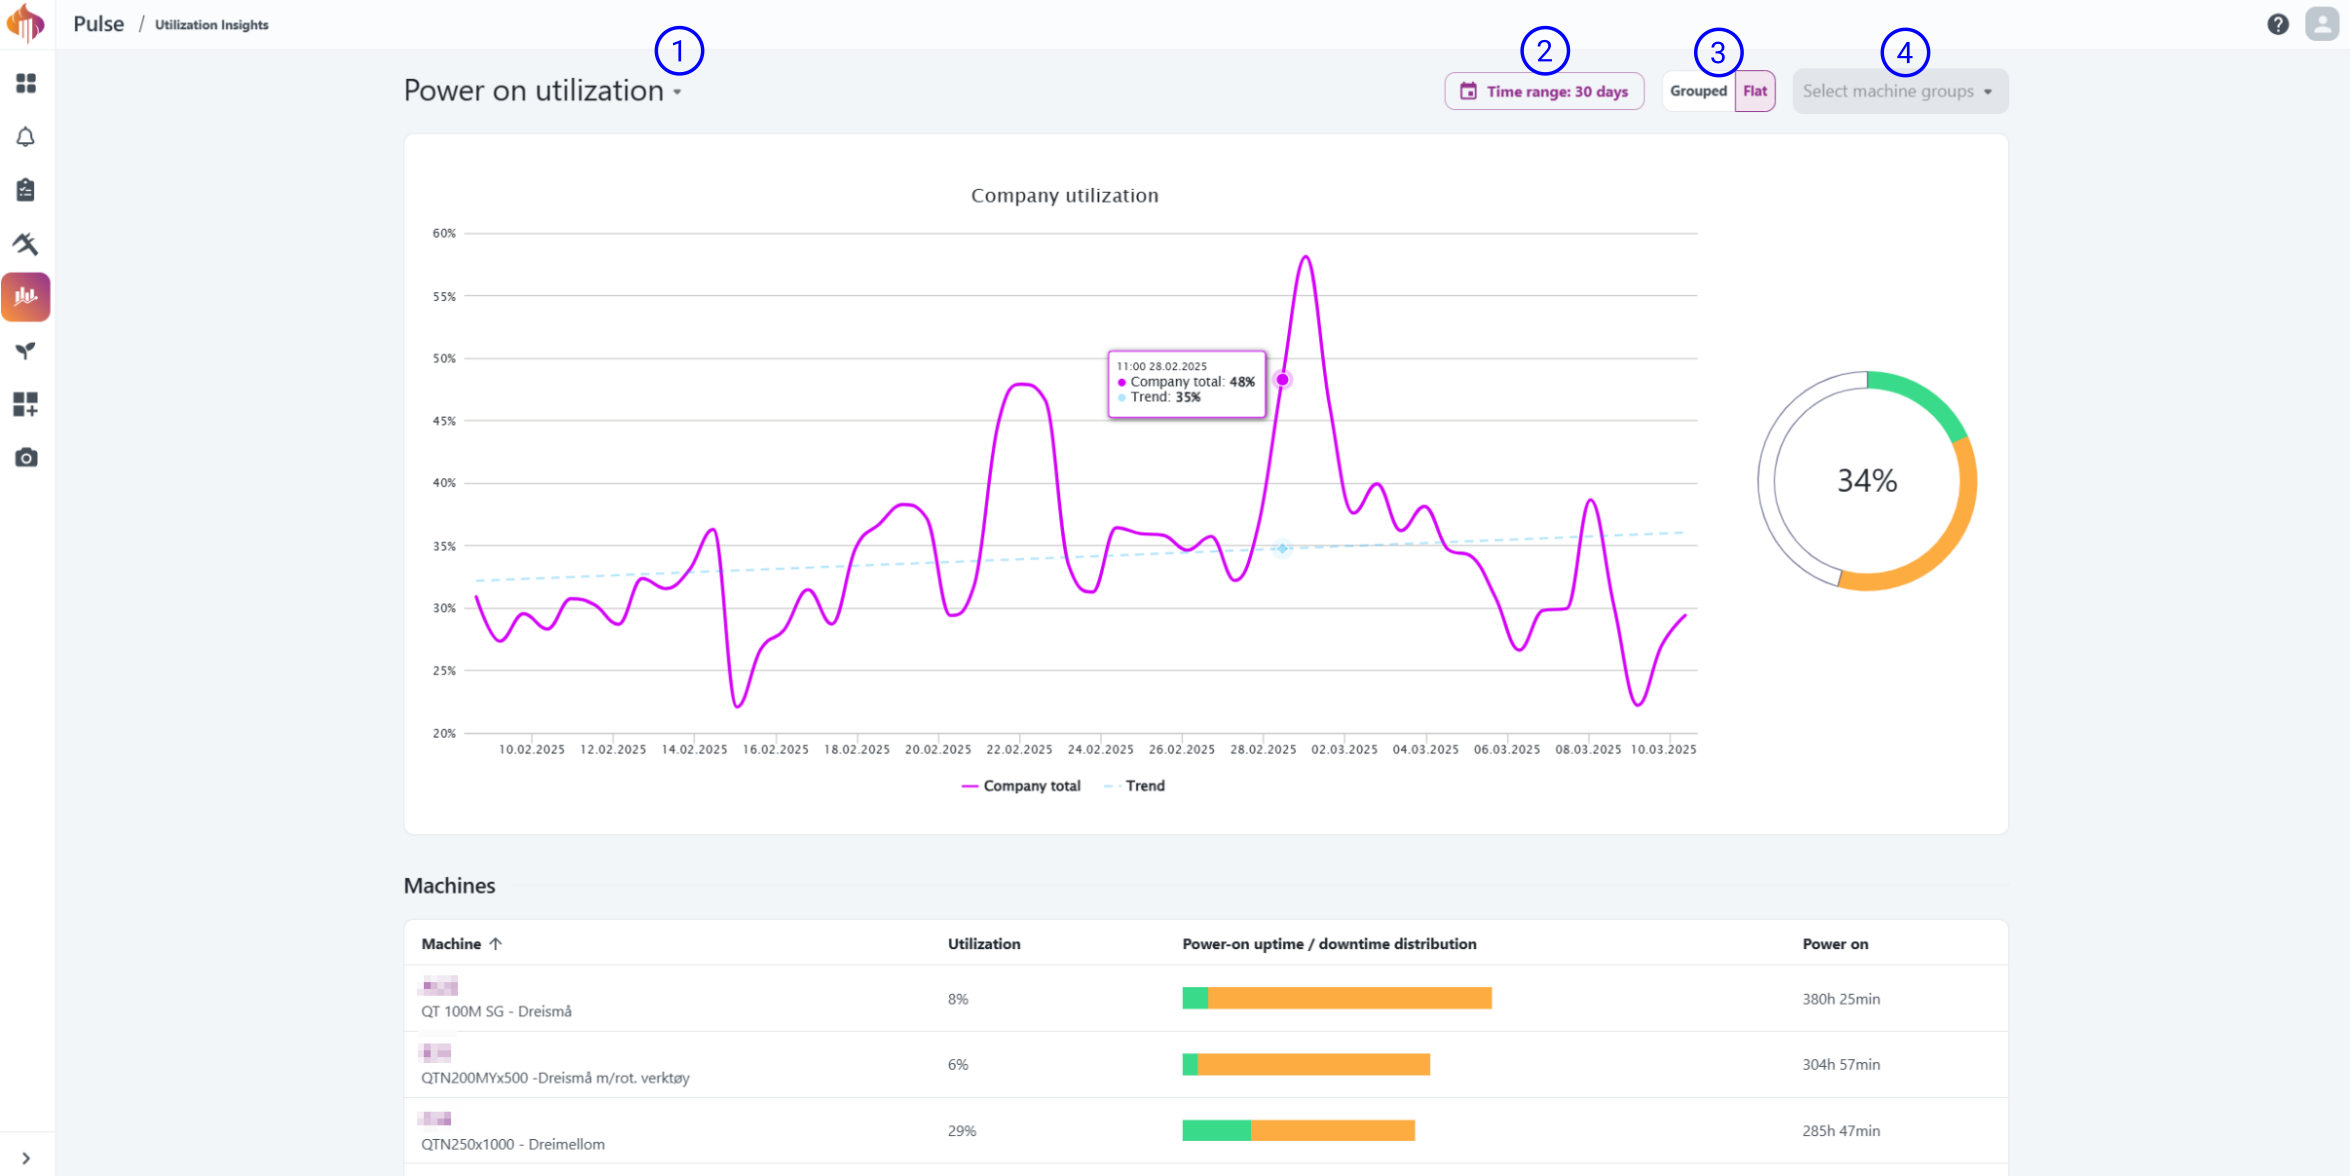
Shift Settings
Shift Settings is the central place for defining how resources work over time. It replaces the older Capacity page and adds support for named shift plans, time-bounded periods, per-period targets, and copy/paste between resources.
Every period you define feeds directly into KPI and OEE calculations, so keeping this data accurate is important for reliable reporting.
Shift Settings is found under Settings → Shift Settings in the KPI menu.
Key concepts
| Concept | What it means |
|---|---|
| Shift plan | A reusable template that describes how many hours a resource works each day of the week. |
| Period | An assignment of a shift plan to a resource, valid from a specific date onwards. A resource can have many periods. |
| Target utilization % | The planned utilization for a resource during a period. Defaults to 100 %. |
| Effective from | The date a period becomes active. The period stays active until the next period's start date. |
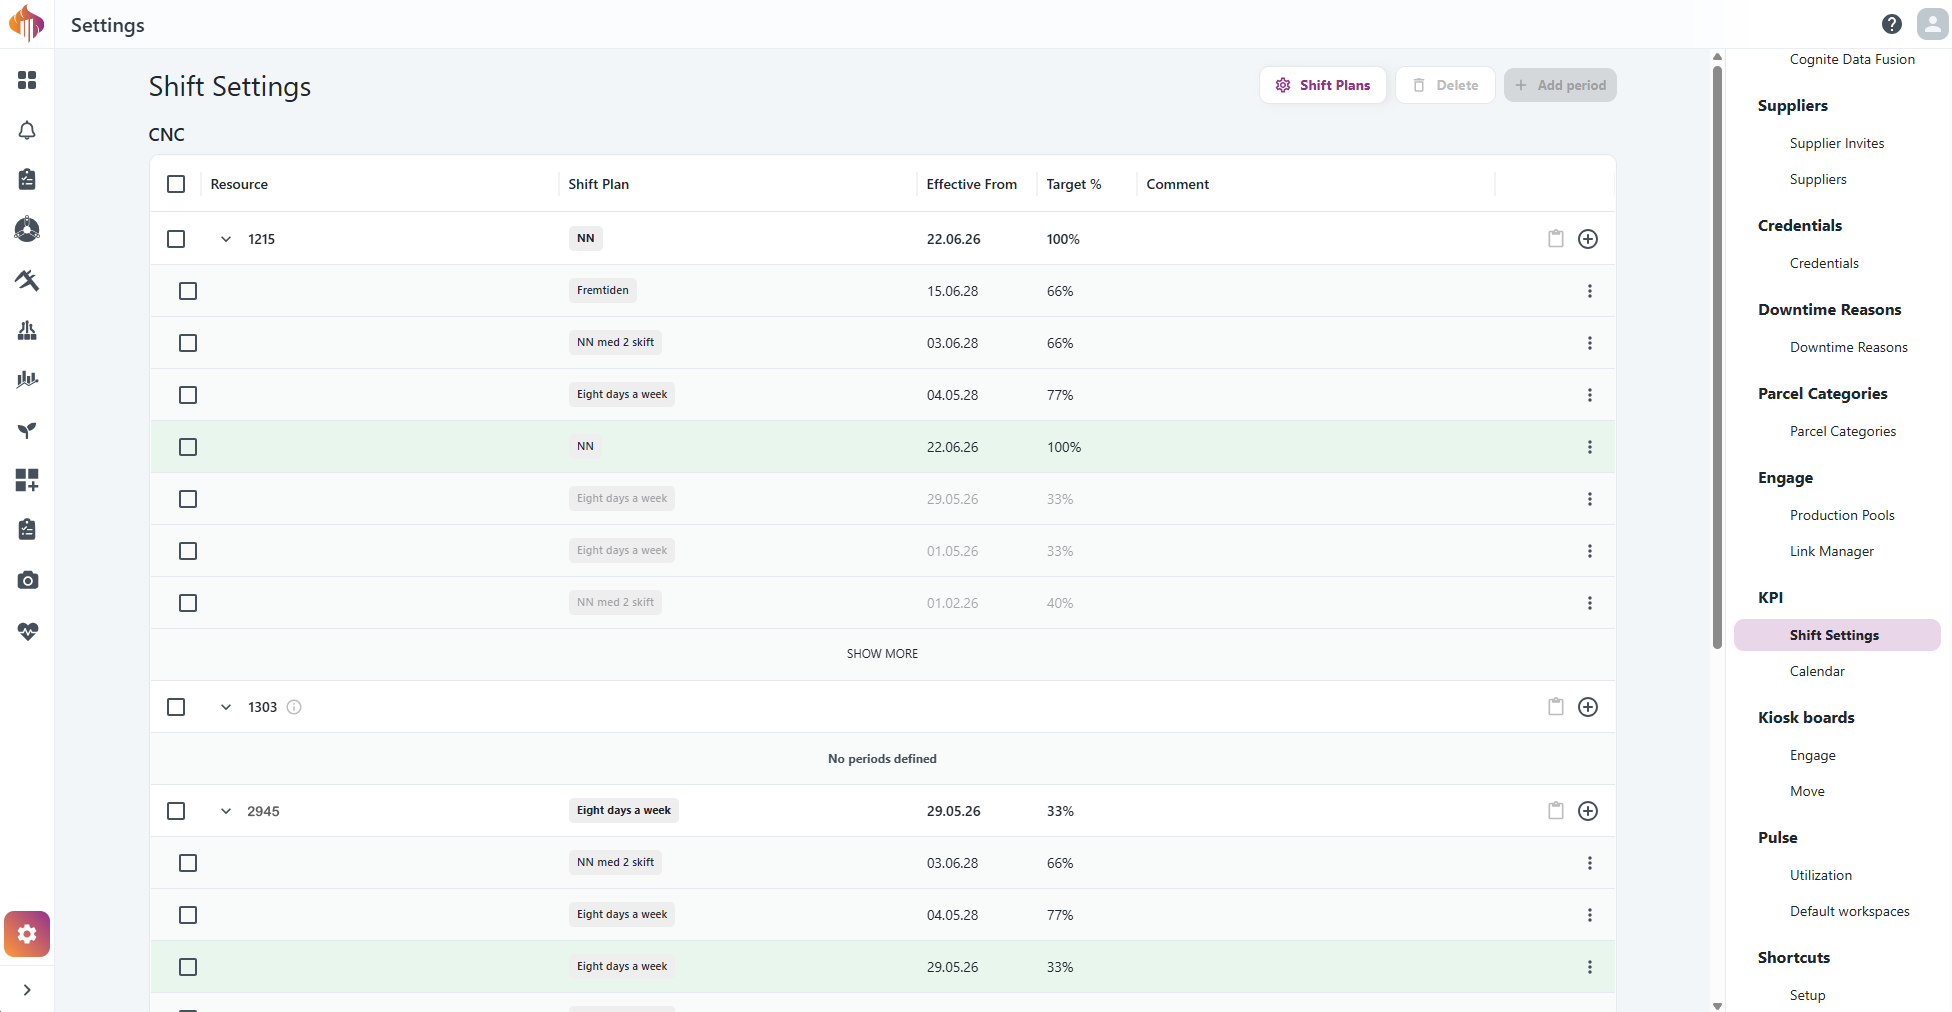
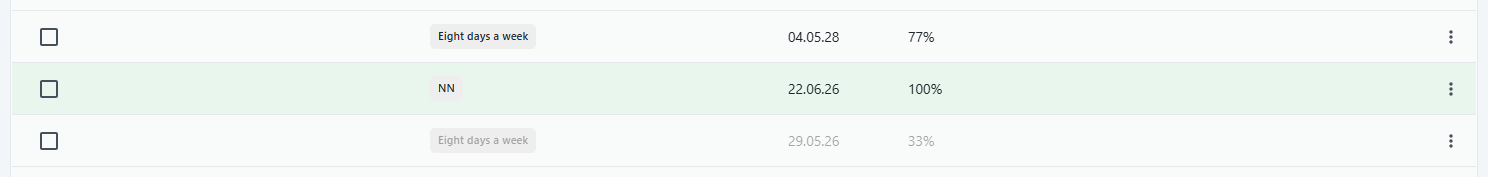
The main table lists all your resources, grouped by department/resource group with its current period. Each resource row can be expanded to show its periods.
Period states
- Current period – highlighted row; this is the active period driving KPI data today.
- Expired period – shown in a faded style; up to 3 past periods are visible per resource by default.
- Show more – click this link below a resource to reveal all older expired periods.
- No periods defined – placeholder row for resources that have not been configured yet.
Managing shift plans
Before you can assign periods to resources you need at least one shift plan. Click the Shift Plans button in the top-right corner to open the shift plan manager.
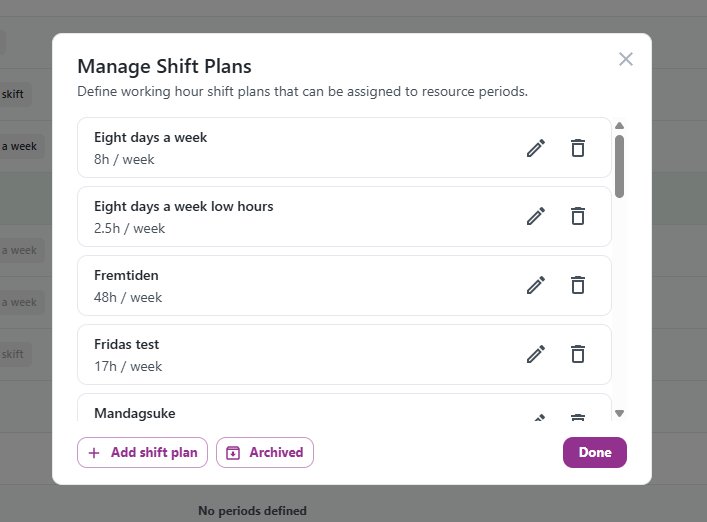
Creating a shift plan
- Click Shift Plans → Add shift plan.
- Enter a name for the plan.
- Fill in the working hours per day for each day of the week. Leave a day empty (or set it to
0) for non-working days. Decimal values (e.g.7.5) are supported. - Click Create shift plan.
Editing a shift plan
Open Shift Plans, find the plan you want to change, and click Edit.
Important: Changes to a shift plan take effect immediately for all periods that use it. A warning is shown in the edit form as a reminder.
Deleting a shift plan
- If the plan is not in use by any period it is deleted permanently.
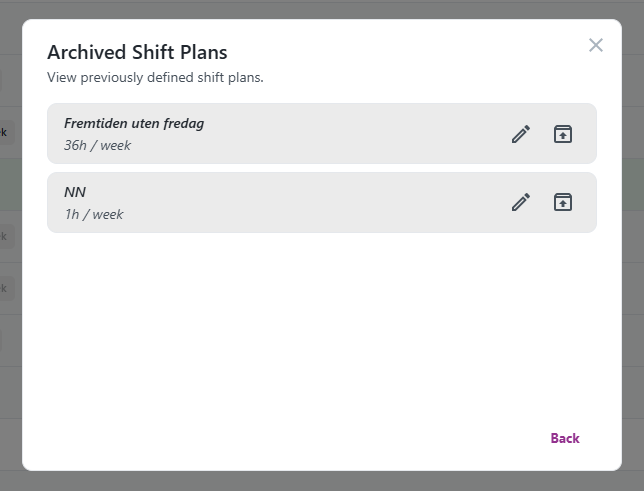
- If the plan is in use, it is automatically archived rather than deleted. Archived plans still appear on any existing period but cannot be selected for new ones.
You can view and restore archived plans from the Archived tab in the Shift Plans dialog.
Adding periods
To one resource
- Expand the resource row in the data grid.
- Click the Add period button that appears on the resource row (or use the ⋮ row menu → Add Period).
- Fill in the form (see Period form fields).
- Click Save.
To multiple resources at once
- Check the checkbox on each resource group row you want to configure.
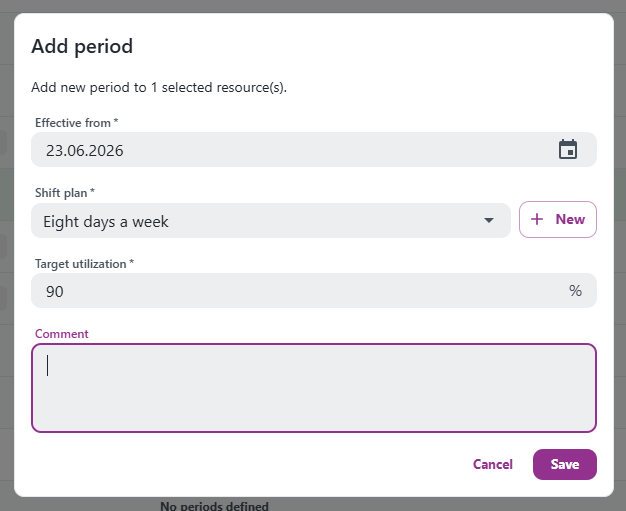
- Click the Add period button in the page header.
- The dialog shows how many resources will be affected.
- Fill in the shared period details and click Save.
All selected resources receive an identical period.
Period form fields
| Field | Required | Notes |
|---|---|---|
| Effective from | Yes | The date from which this period is active. |
| Shift plan | Yes | Choose from active shift plans. Hover over an option to preview the hour breakdown. Click New to create a plan on the spot without leaving this dialog. |
| Target utilization % | Yes | Defaults to 100. Represents planned utilization for KPI purposes. |
| Comment | No | Useful for documenting why a period was created (e.g., "Summer schedule", "After line upgrade"). |
Creating a shift plan from within the period form
If you realize the shift plan you need does not exist yet, click the New button next to the Shift Plan field. A mini-form opens inline, letting you define the plan and return to the period without losing your other inputs.
Editing a period
Click the ⋮ menu → Edit.
Your role determines what you can change:
| Role | Can edit |
|---|---|
| Shift Settings | All fields: effective from, shift plan, target %, comment |
| Resource Target Write | Target % only |
Copying and pasting periods
If you want to replicate a period's settings to another resource:
- Click the ⋮ menu on the source period → Copy.
- Navigate to the target resource and expand it.
- Click the paste icon on the resource group row.
The copied data persists until you copy something else or leave the page.
Deleting periods
Single period
Use the ⋮ menu → Delete on the period row and confirm the dialog.
Bulk delete
- Select the periods you want to delete using the row checkboxes.
- Click the Delete button in the page header.
- Confirm.
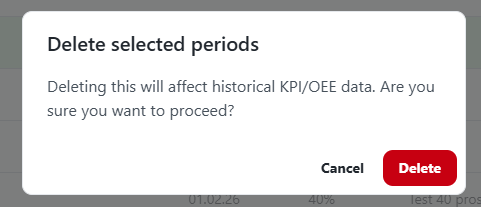
Warning: Deleting a period affects historical KPI and OEE data. The confirmation dialog reminds you of this. If you are unsure, consider editing the period instead.
Factory Calendar settings
Factory calendar settings are only available for Admins and can be accessed in the bottom-left corner if you have the Admin role.
The factory calendar defines the baseline working hours for the entire site, including normal weekly hours, holidays, and half-days. These settings serve as the foundation for OEE calculations.
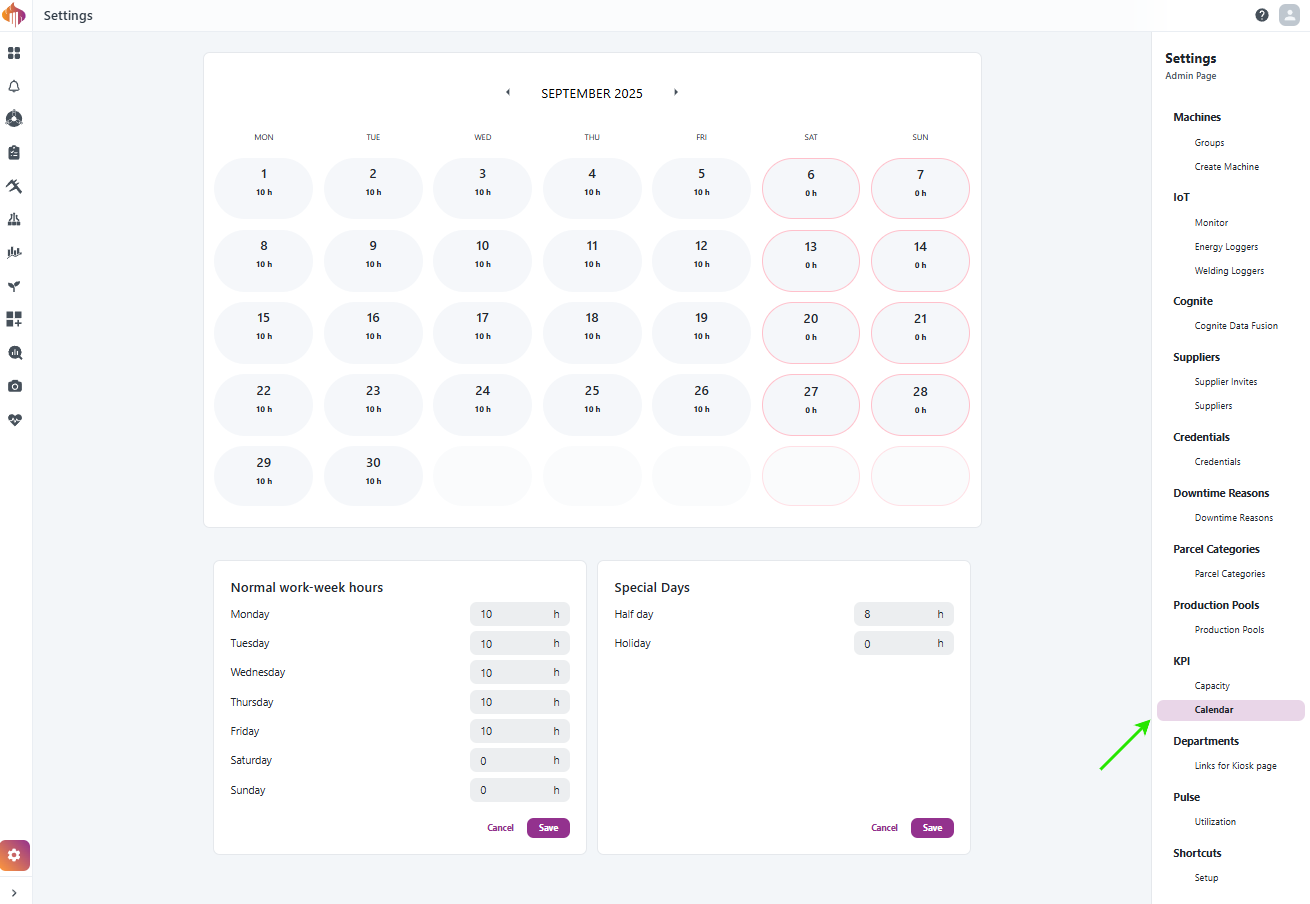
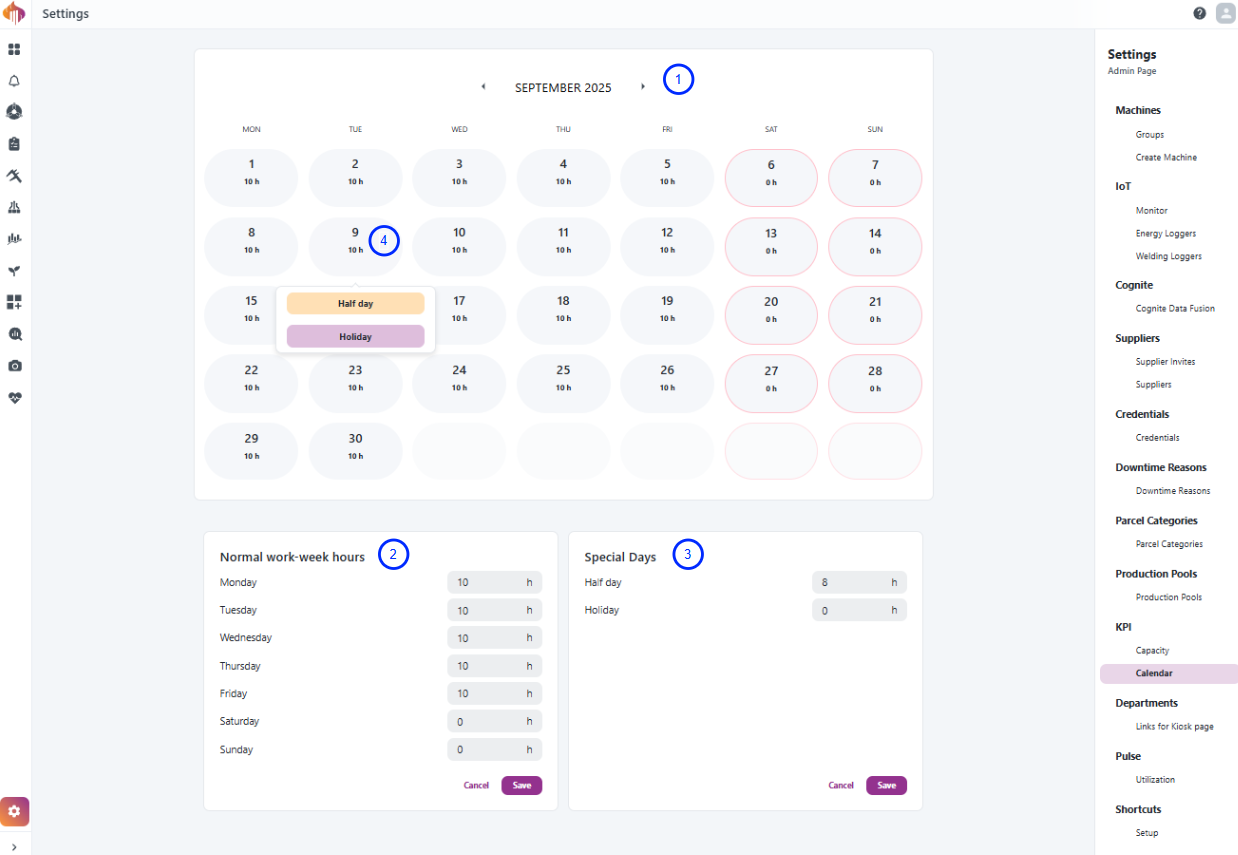
Descriptions:
-
Calendar view: Shows configured hours per day for the selected month. Special days (half days, holidays) gets highlighted.
-
Normal work-week hours: Define the standard expected hours per weekday (e.g., Mon–Fri 10h, Sat/Sun 0h).
-
Special days: Configure exceptions such as half days or holidays. These override the normal weekly hours.
-
Overrides: Apply special rules directly in the calendar view (e.g., mark a specific date as a holiday).
Downtime reasons
Downtime refers to any period when a resource is unavailable or not operational, impacting productivity.
To track and analyze these interruptions, users can report downtime reasons in two ways, both shown in this chapter.
Additionally, we provide a dedicated Downtime report for deeper insights into all reported downtime reasons within the selected time range.
Downtime reasons can be configured in the Admin settings of Ignos.io. This option is only available to Admins and can be accessed from the bottom-left corner if you have the Admin role.
Report through the Resource Activity Timeline
Select which machine state or work order you want to report a downtime reason for. In the dialog, you can adjust the start and end time, select an Order or No order, select a downtime reason, and add an additional comment.
When you select an order, the related part number and part name are stored together with the downtime reason. This makes it easier to analyze downtime by order and part later in the Downtime Report.
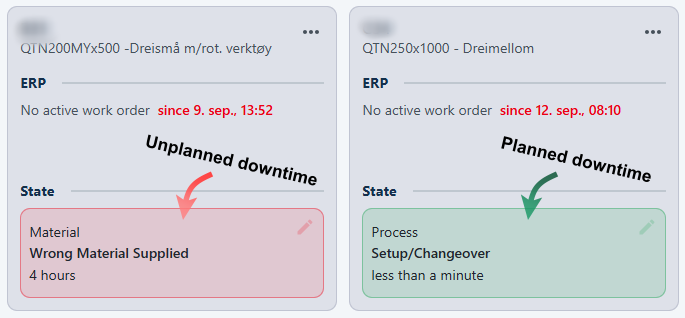
Report through Machine States
Click "Report Downtime" at the bottom of relevant Resource card. Select an Order or No order, select a downtime reason, add an additional comment, and choose if it should follow the machine state if available.
If an active order is available for the selected resource and time, Pulse shows it in the Order selector. The selected order's part information follows the downtime reason and is shown in the report.
Resources with machine states will give you the opion "End downtime reporting when the machine state changes". If this is enabled, the reporting will end automatically when the machine state changes.
Resources that have active downtime reports will display a marker.
You can easily end or edit active downtime reporting by clicking the downtime report marker and pressing the stop button or checking/unchecking the "End downtime reporting when the machine state changes" option.
Report through the Downtime Reason widget in Workspace
The Downtime Reason widget in Workspace allows the user to very easily report downtime.
More info about this widget can be found in its own chapter.
How to report:
Downtime Report
The Downtime Report gives deeper insights into the duration of all reported downtime reasons. It is built as a data grid, so you can sort and filter the list directly from the column headers.
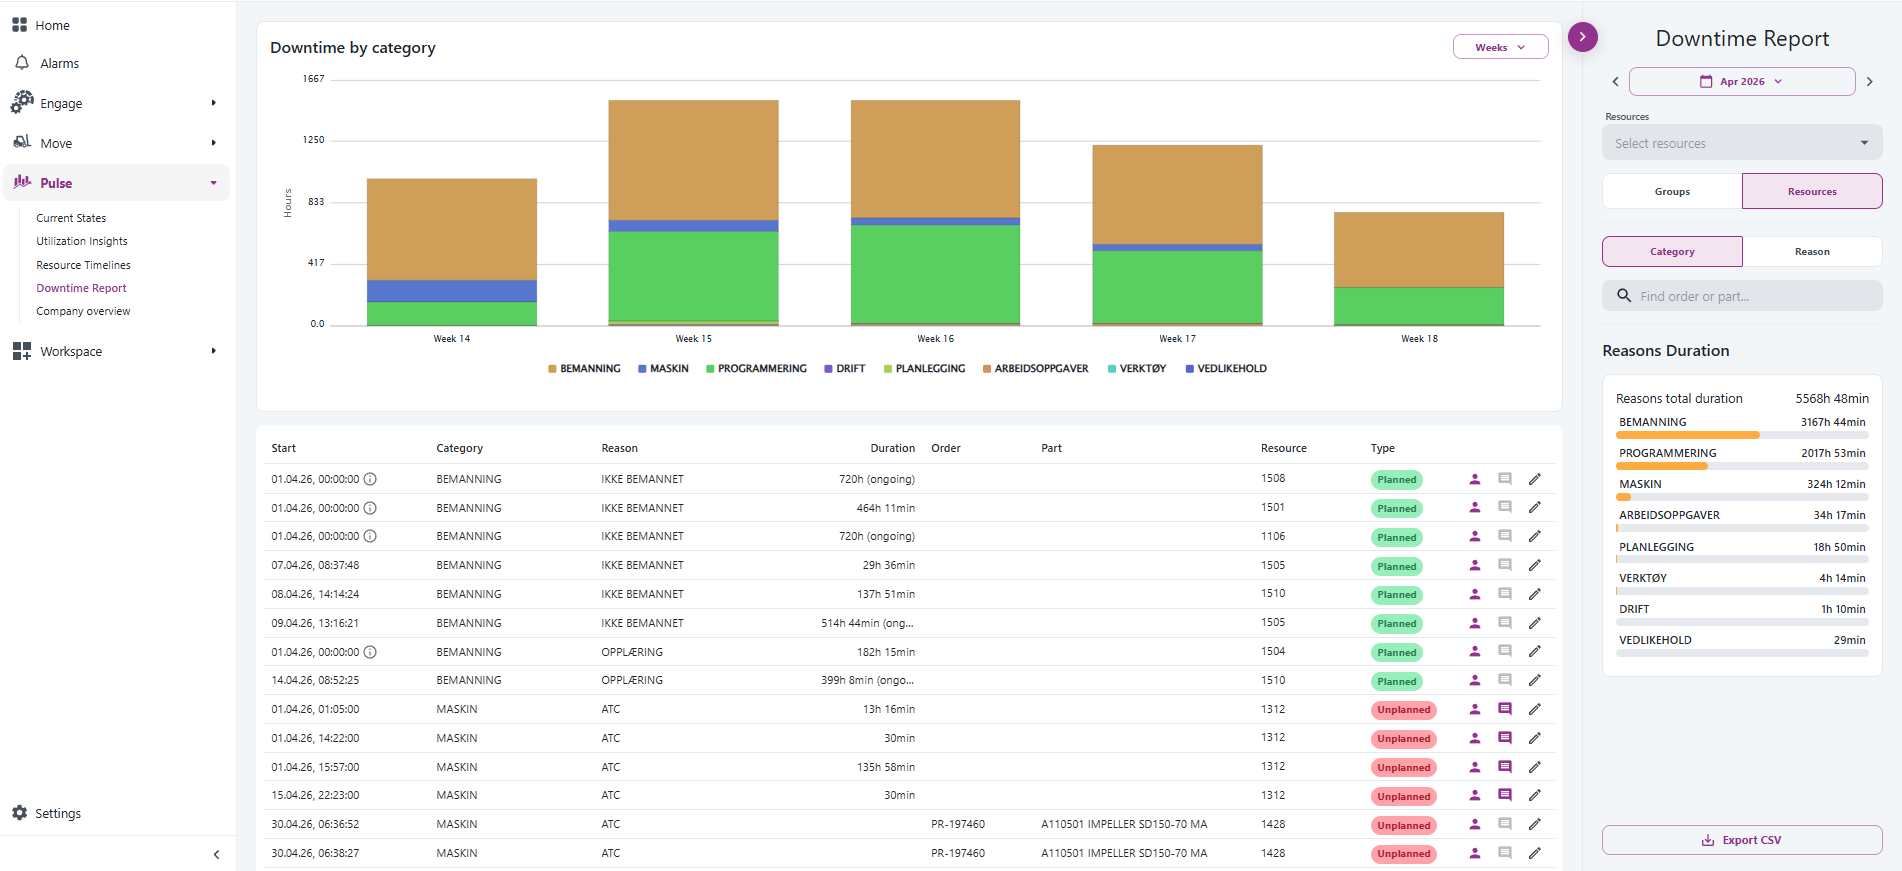
The report includes the following columns: Start, Category, Reason, Duration, Order, Part, Resource, and Type.
Use the right-side filters to choose the period, machines, and groups you want to inspect. The search field below the machine selector has the placeholder Find order or part... and lets you search the report by order, part number, or part name.
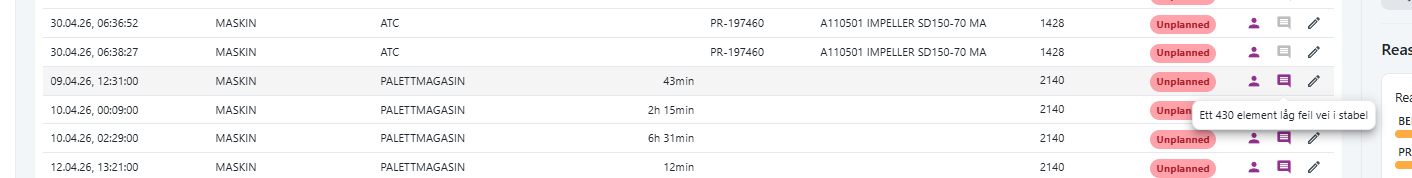
Hover over the Resource cell to see more resource information, such as description and resource groups when available. The person icon shows who created or last updated the report. The comment icon shows the registered comment on hover, and is highlighted when a comment has been added. Use the pencil icon to edit an existing downtime reason.
Press Export CSV from the bottom of the right margin to export the report. The export respects the selected period, machines/groups, and order/part search. The downtime export includes category, order, part number, and part name information.
In the mentioned margin found on most pages in the Pulse app you will also have the Top planned and Top unplanned downtime reasons displayed:
Downtime Reasons settings
Downtime reasons can be configured in the Admin settings of Ignos.io. This option is only available to Admins and can be accessed from the bottom-left corner if you have the Admin role.
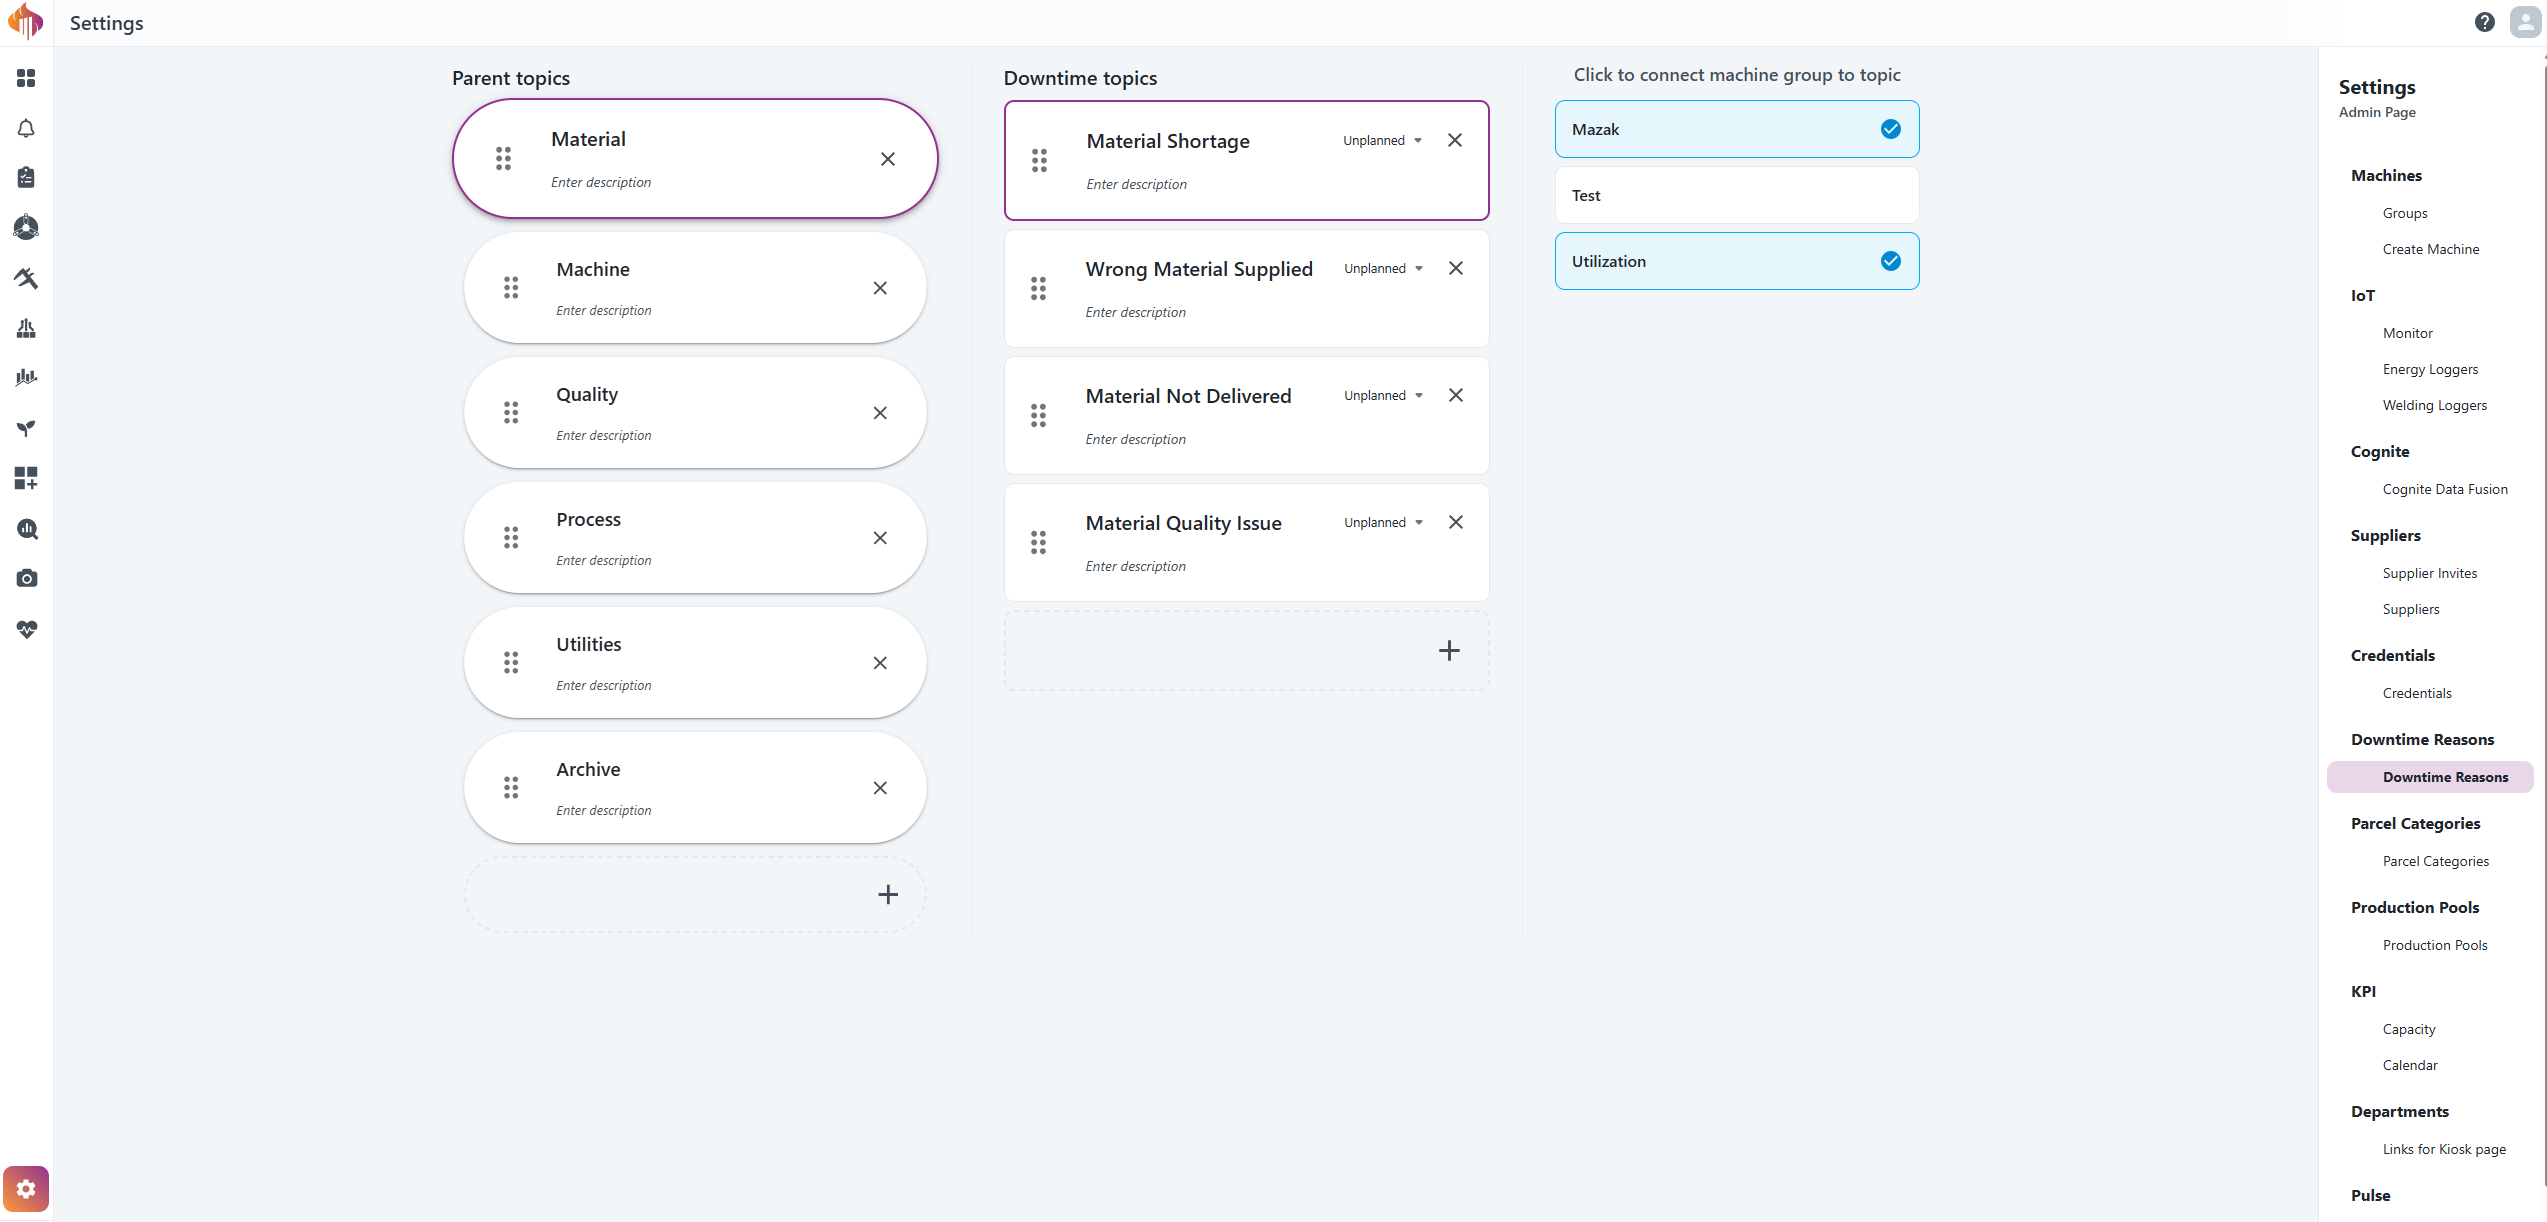
Descriptions:
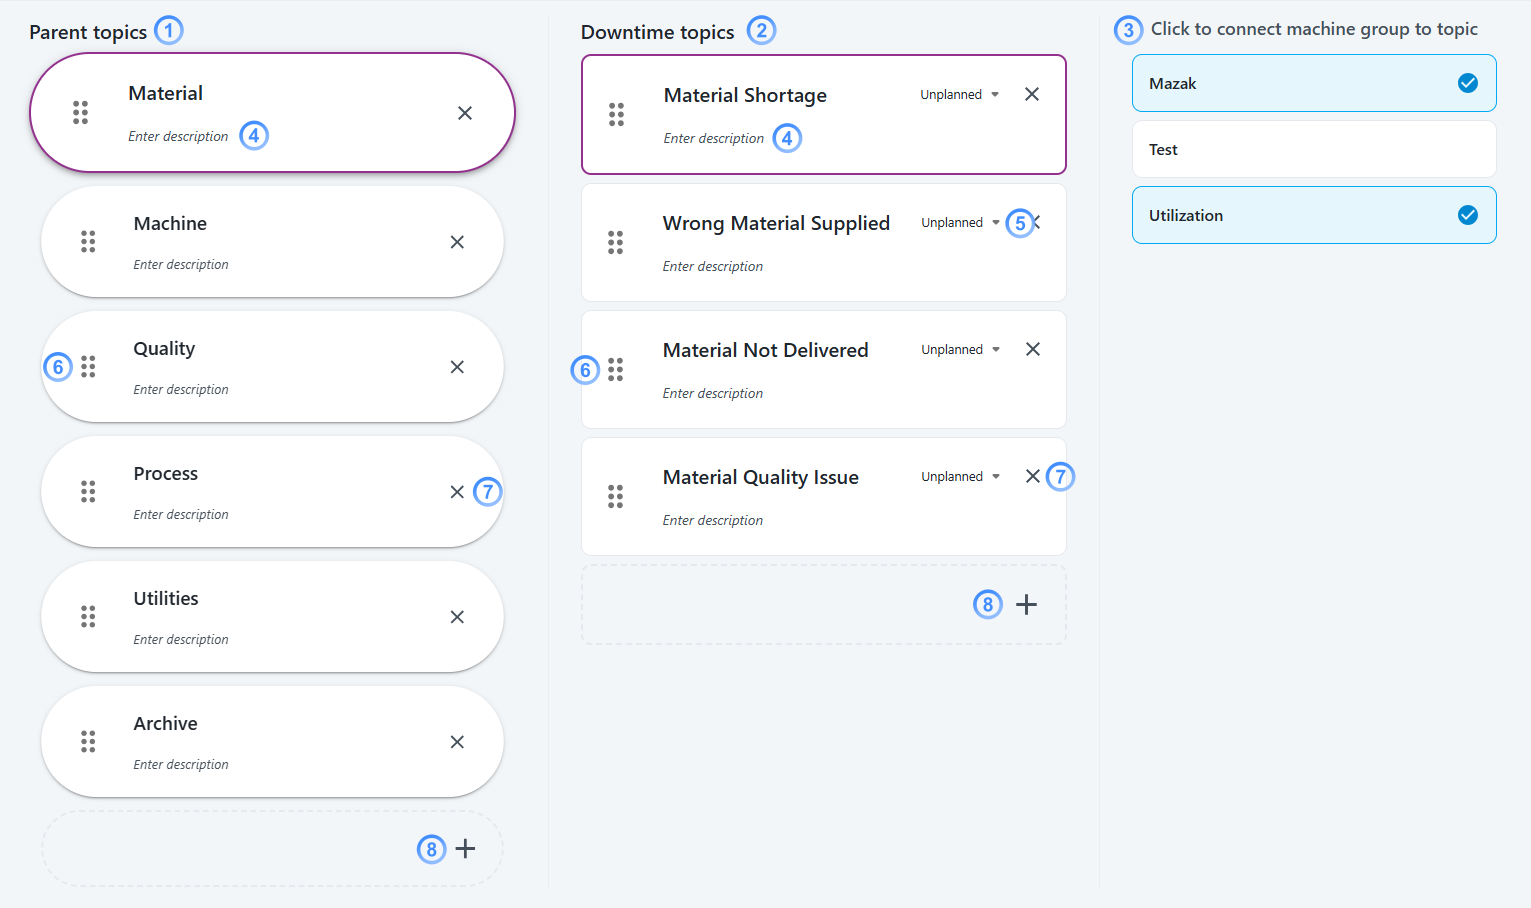
-
Parent topics: Add parent topics as needed (see point 8). Select a Parent Topic by clicking on a parent topic card to view its associated Downtime topics. The selected card will be highlighted, and the Downtime topics list will update to the left.
-
Downtime topics: Add downtime topics linked to the selected parent topic as needed (see point 8). Select a Downtime Topic by clicking on a Downtime Topic card to view its associated Machine Groups. The selected card will be highlighted, and the Machine Groups list will update to the left.
-
Machine group: Link selected Downtime topics to a machine group. The downtime reasons will appear when reporting Downtime Reasons on resources that are linked to selected machine groups
-
Description: Provide additional context for the defined topic. This will appear as a tooltip when hovering over the topic while reporting:
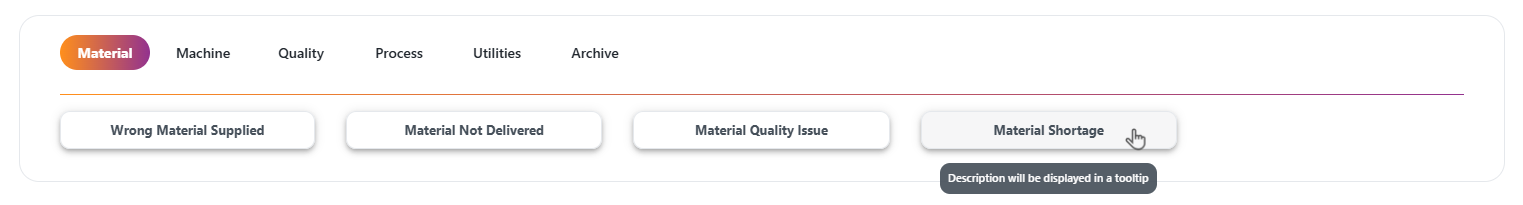
-
Planned/Unplanned: Specify whether the Downtime Topic should be categorized as Planned or Unplanned.
-
Sorting: Click and hold the drag handle next to an item to sort the order of the topics via drag-and-drop.
-
Delete topic: Press the x icon inside the box to delete a topic.
-
Add more topics: Click the plus-button to add more topics.
Pulse Widgets for Workspace
You will find everything Pulse-related regarding the Workspace module in this chapter. These widgets can be used in regular workspaces, templates, and default resource workspaces.
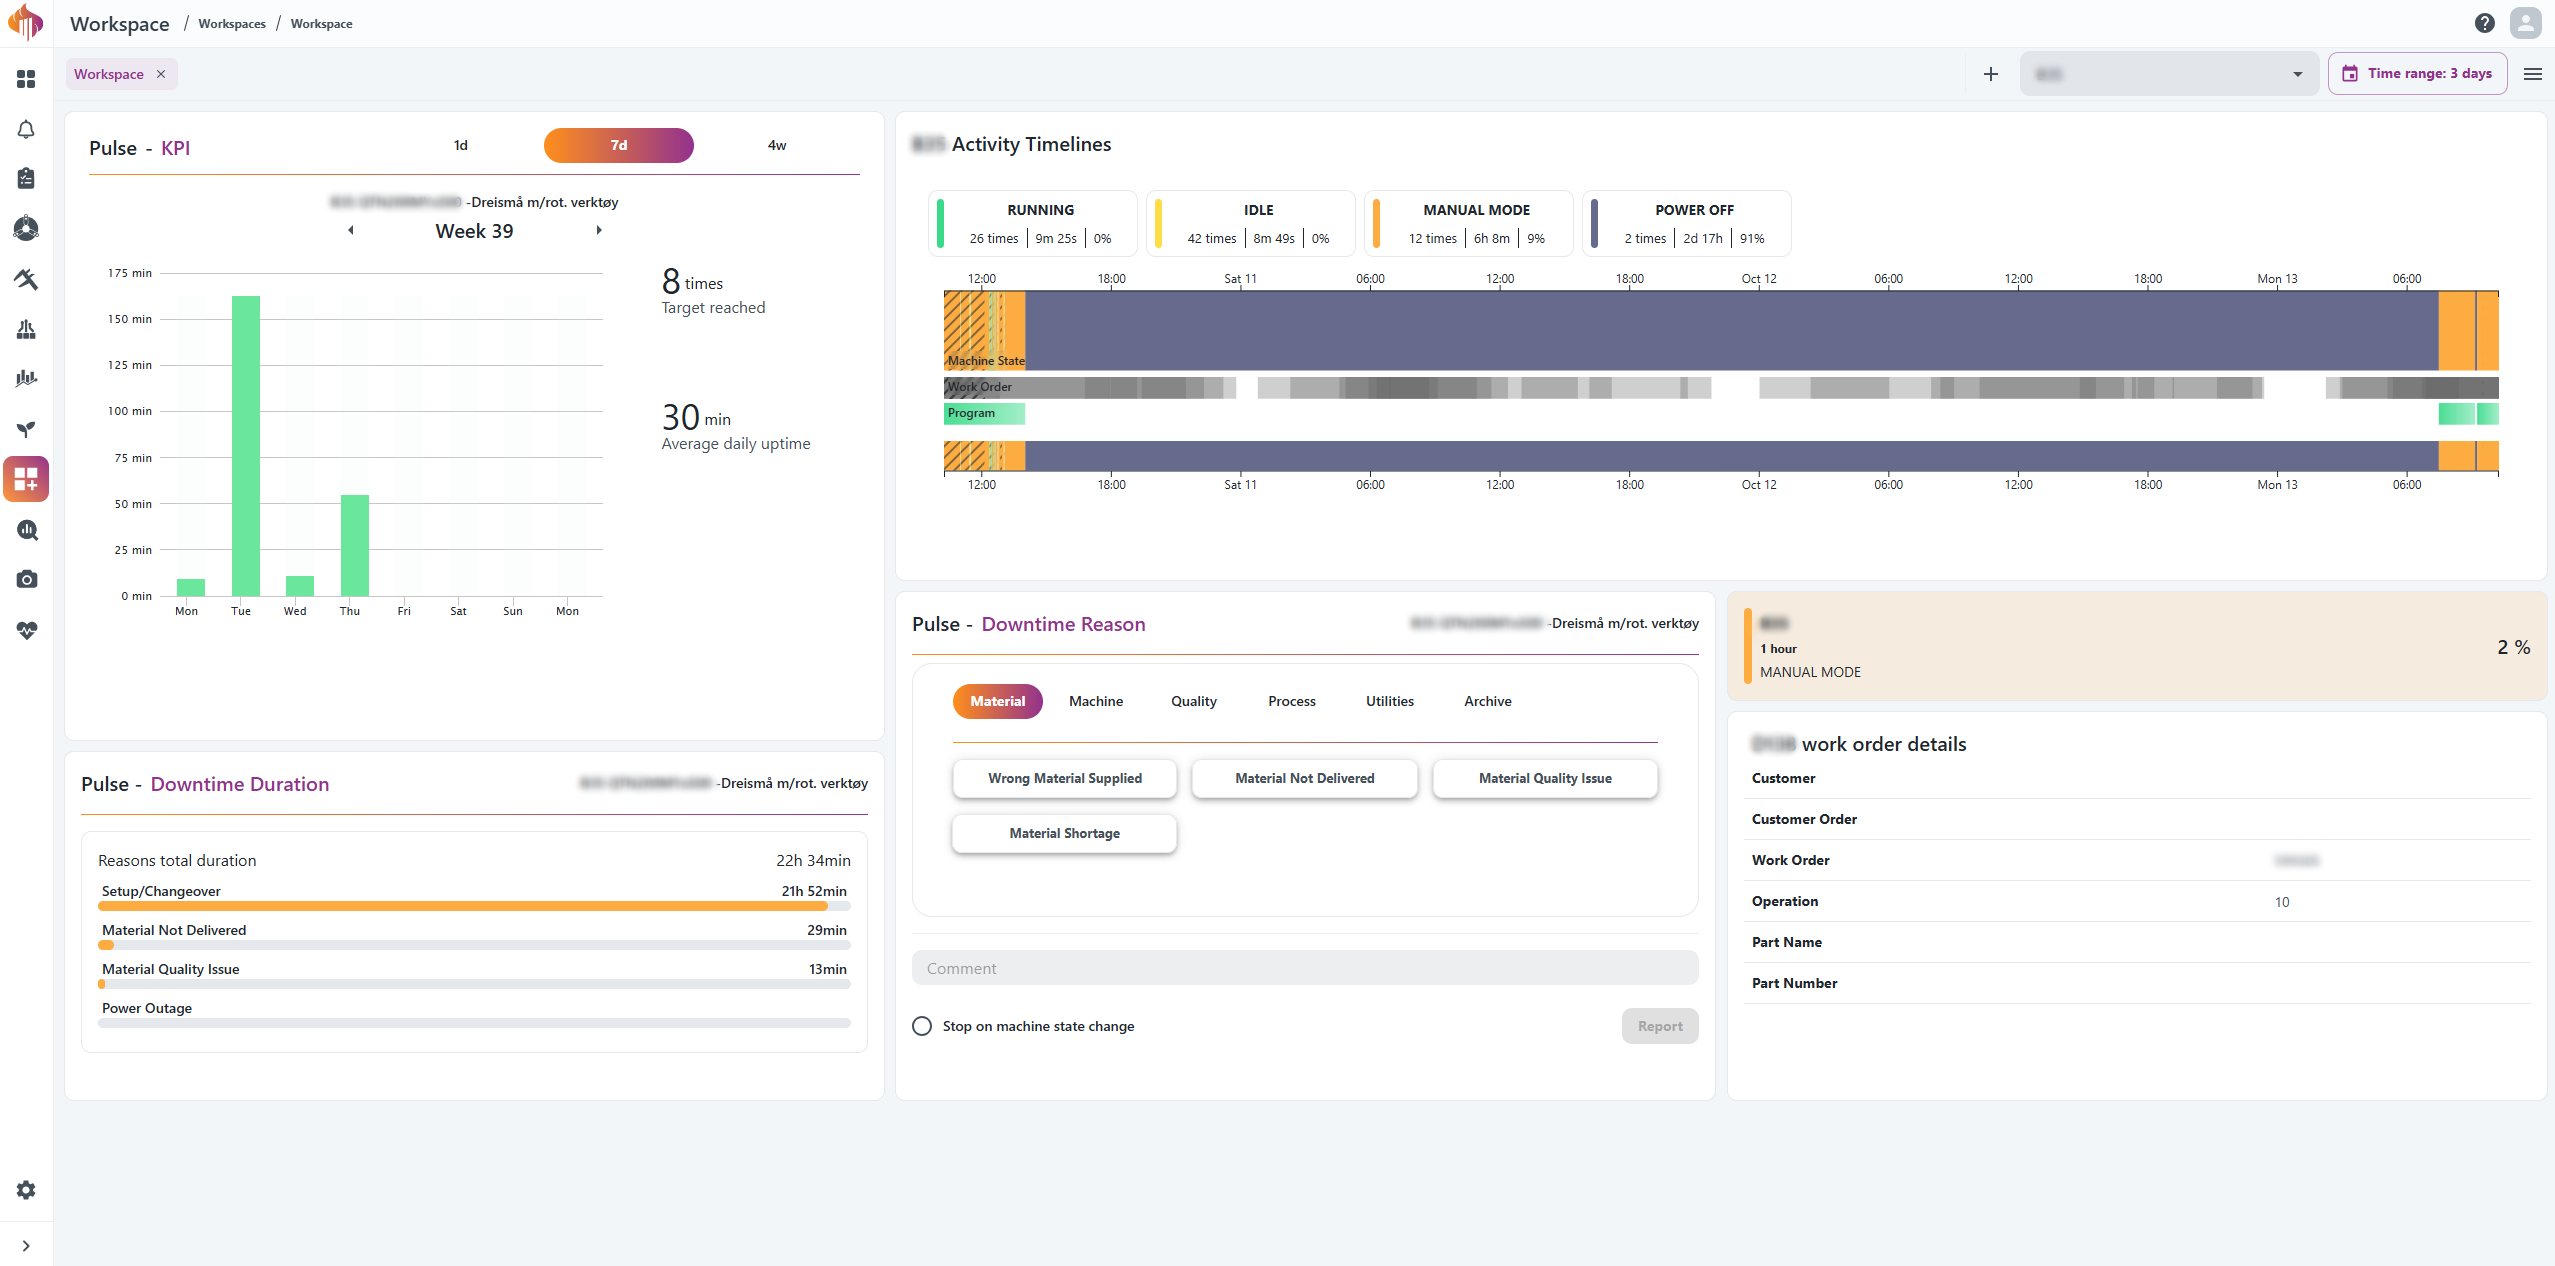
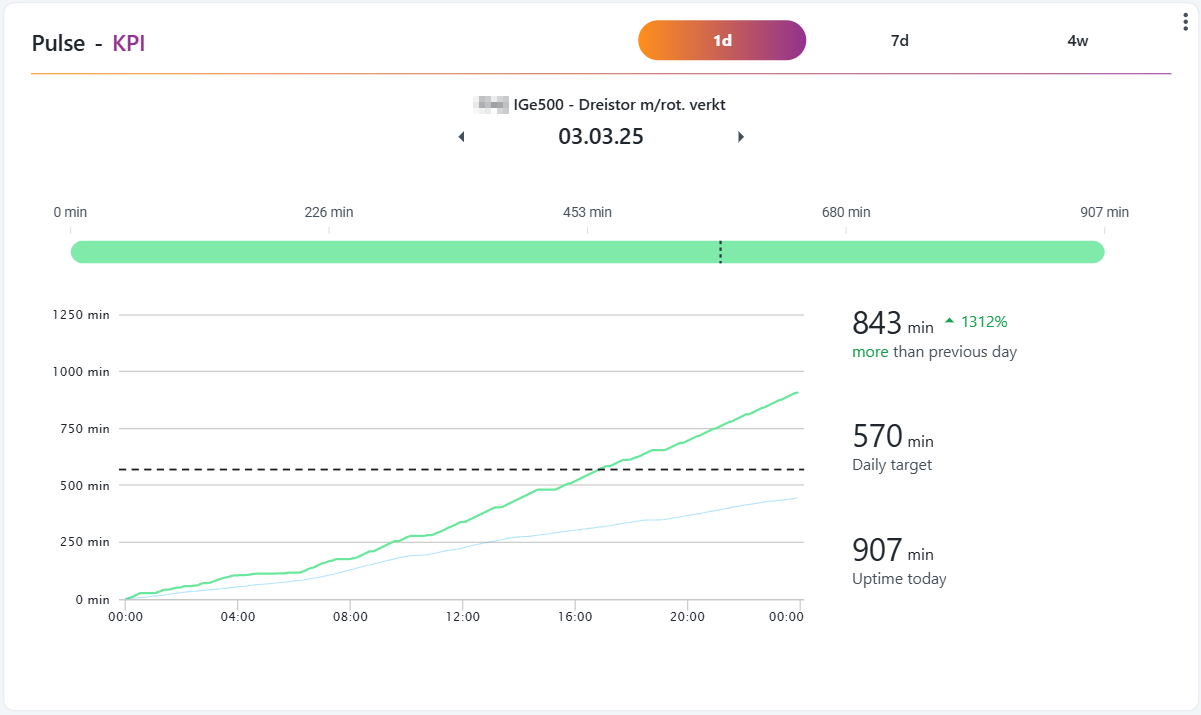
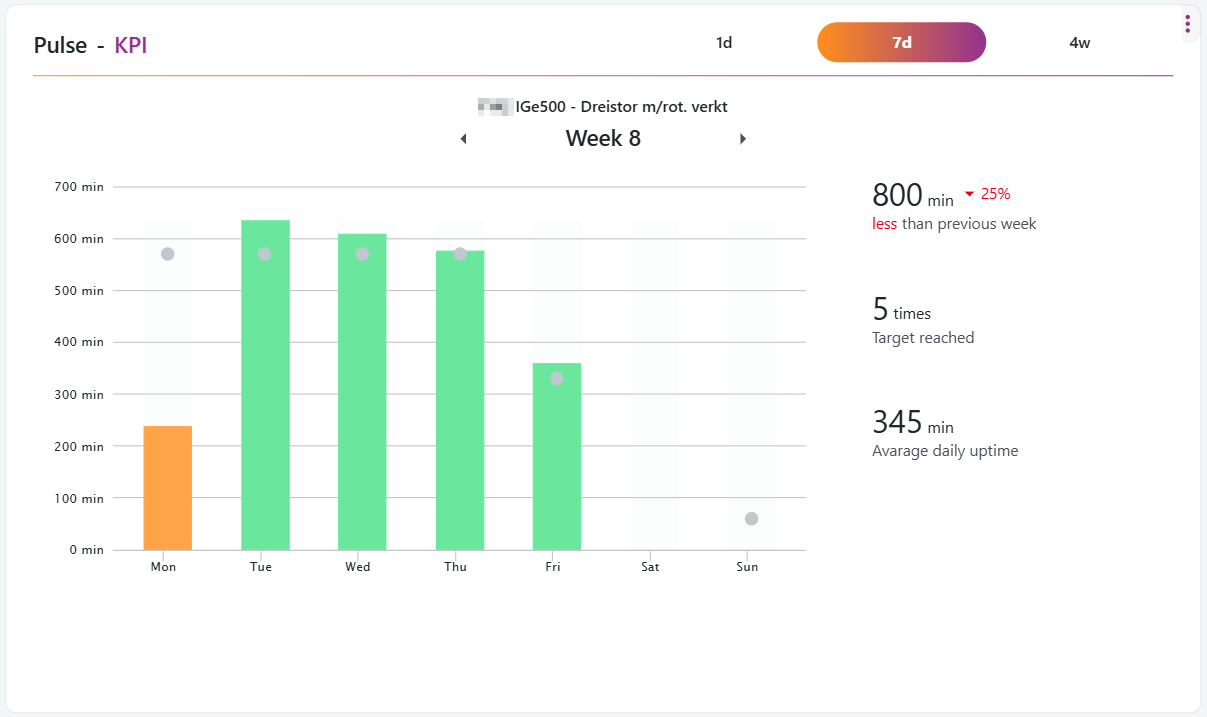
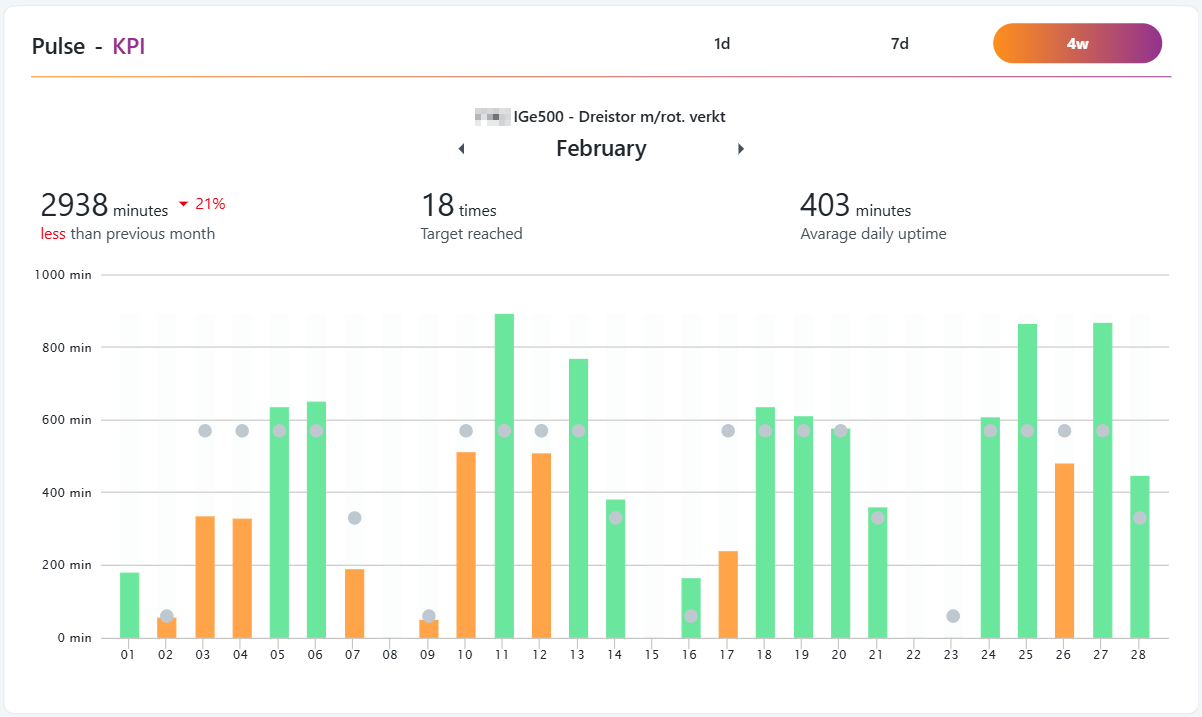
KPI widget
The KPI widget is very much inspired by modern fitness trackers.
This widget works very similar to a step-counter. It counts only the uptime and has a daily target-uptime, based on the capacity defined in the Ignos.io settings. The user can deep-dive back in time, and display each day in either of three formats: 1d (1 day), 7d (1 week) or 4w (1 month).
Downtime Reason widget
The Downtime Reason widget simplifies reporting of downtime reasons significantly.
This widget lets you select between downtime topics and start reporting. This way, users can easily report downtime without having to report through the Resource Activity Timeline.
How to report a state:
How to use:
- Make sure you have a resource selected in your workspace, or select a static resource for the widget in the top left corner.
- Select an Order or No order. If an order is selected, the related part information is saved with the downtime reason.
- Select a downtime topic and optionally add a comment.
- If the resource records machine states, you can choose to mark Cancel on machine state change. This will automatically stop reporting when the machine state changes.
- Click report to start the reporting process.
- If Cancel on machine state change is not selected, the reporting will stop when you click the stop button.
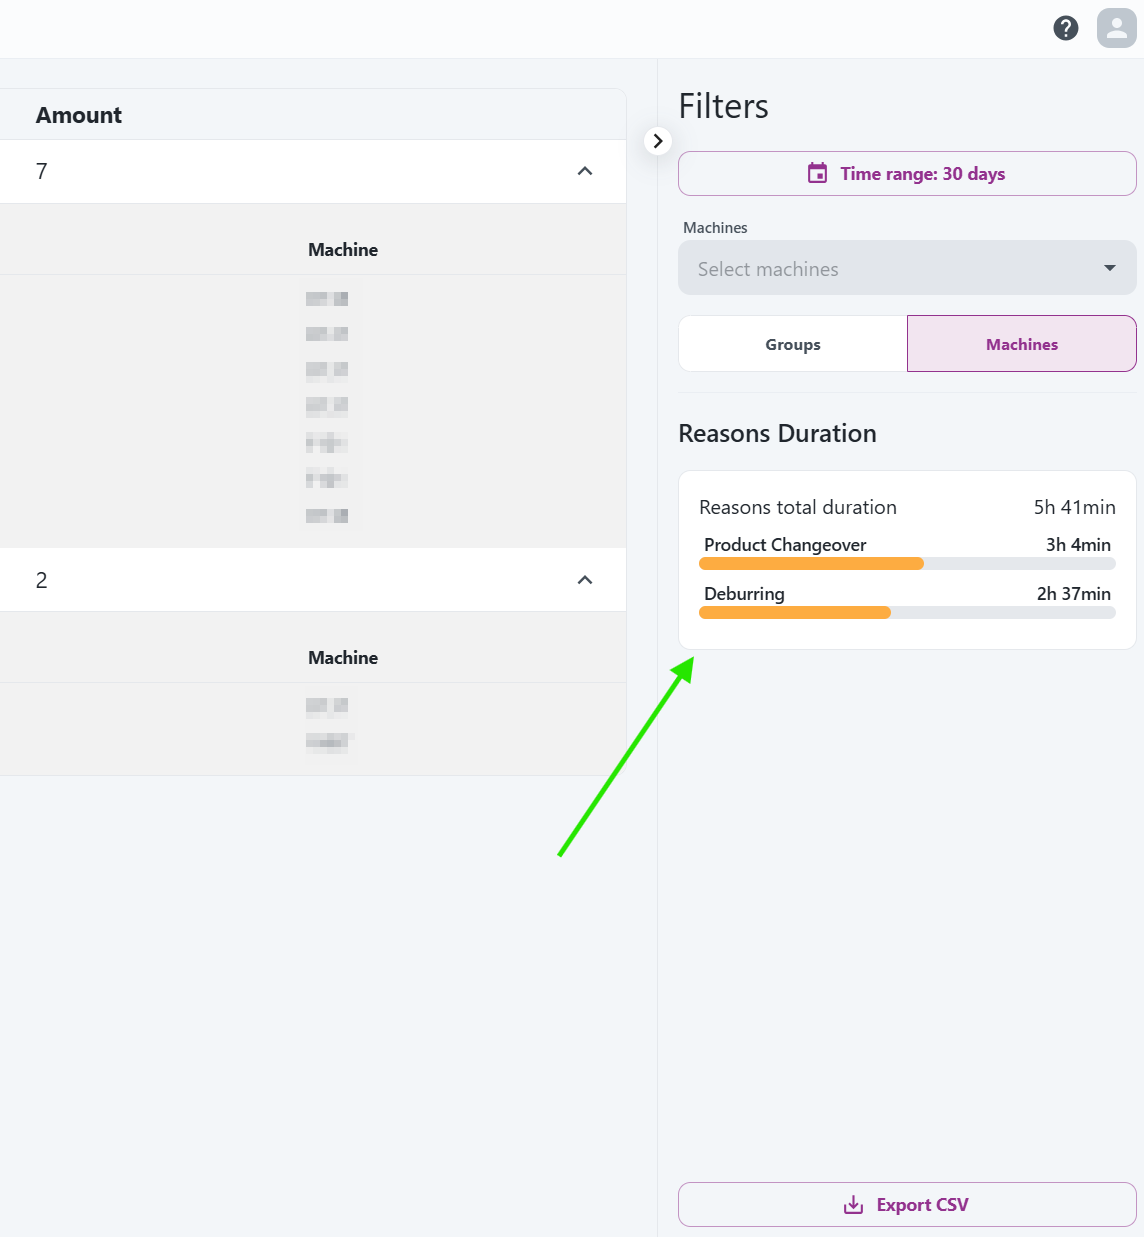
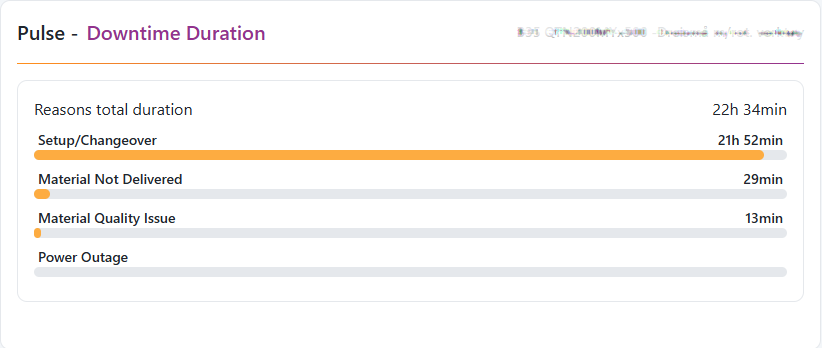
Downtime Duration widget
The Downtime Duration widget gives a quick, at-a-glance view of reported downtime reasons and their total duration, based on your selected resource and time range.
Resource Activity Timeline widget
The Resource Activity Timeline is availble as a widget in workspace. Watch demo here.